

On-Time In-Full (OTIF / DIFOT) Calculator & Root-Cause Analyzer
Free On-Time In-Full (OTIF / DIFOT) supply chain calculator. Audit order-level and unit-level OT%, IF%, OTIF%, SLA compliance, and failure root causes in your browser.
Open toolAudit warehouse fulfillment across three granularity levels—Unit (Case) Fill Rate, Line Fill Rate, and Complete Order Fill Rate—while separating initial first-pick shipments from backorder recovery and cancelled quantities.
Enter the inputs, then select Analyze Fill Rate.
Result will appear here
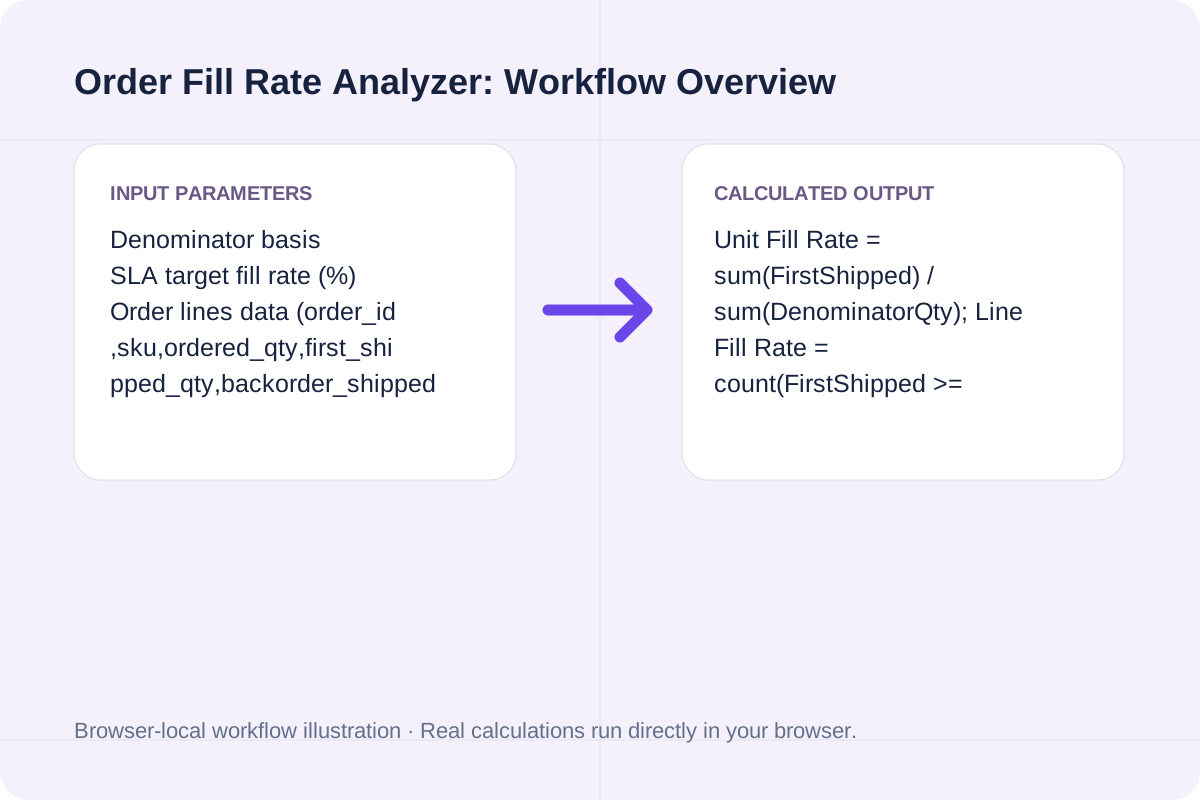
Paste your order line CSV records (`order_id, sku, ordered_qty, first_shipped_qty, backorder_shipped_qty, cancelled_qty`) and choose either Net Demand or Gross Demand denominator rules.
Unit Fill Rate = sum(FirstShipped) / sum(DenominatorQty); Line Fill Rate = count(FirstShipped >= DenominatorQty) / TotalLines; Order Fill Rate = count(AllLinesCompleteOnFirstShip) / TotalOrders.
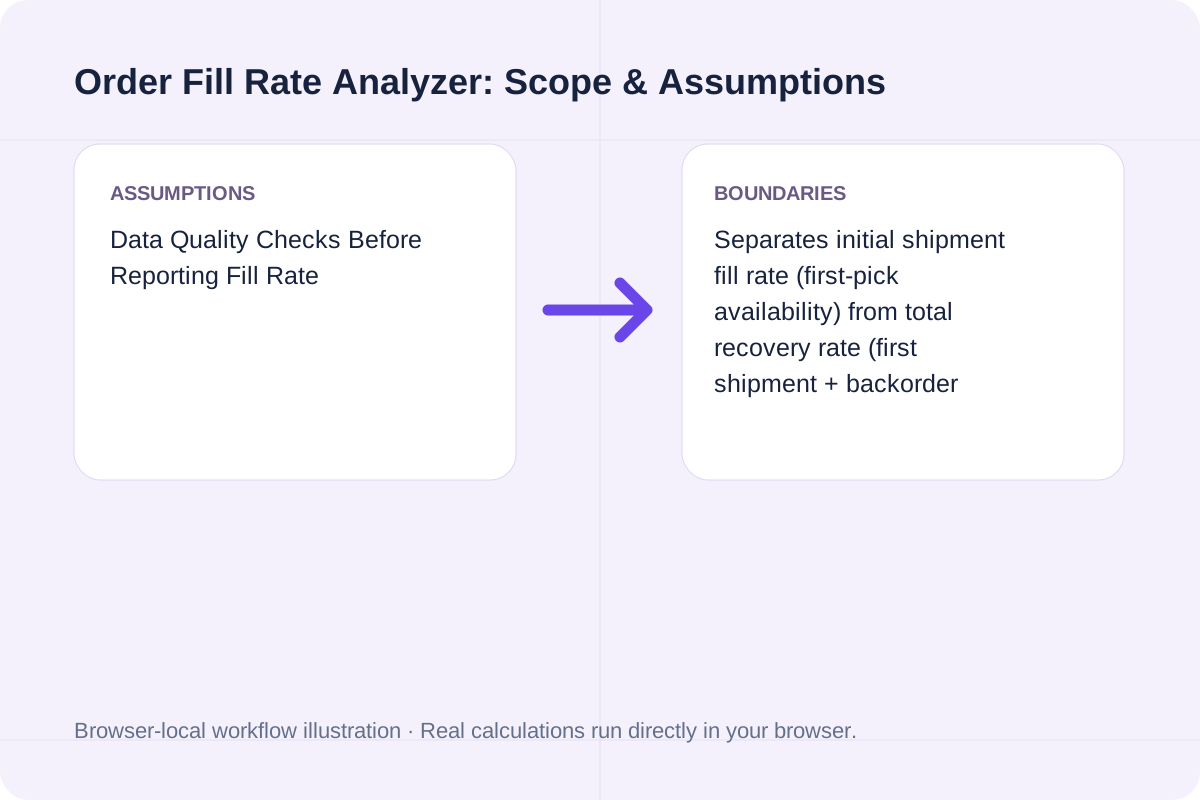
Separates initial shipment fill rate (first-pick availability) from total recovery rate (first shipment + backorder fulfillment) and never conflates warehouse fill rate with ecommerce checkout conversion.
Compare how the three standard APICS / ASCM fulfillment metrics behave on the same multi-line warehouse dataset.
| KPI Metric | Formula | Strictness Level | What It Reveals |
|---|---|---|---|
| Unit (Case) Fill Rate | `sum(First Shipped Qty) / sum(Net Ordered Qty)` | Lowest (Volume-weighted) | Overall inventory volume availability across all units. |
| Line Fill Rate (LFR) | `Full First-Ship Lines / Total Active Lines` | Medium (SKU-line level) | How often individual SKU picks are shorted or split. |
| Order Fill Rate (OFR) | `Orders 100% Complete on 1st Ship / Total Orders` | Highest (Order level) | Share of customer orders shipped in a single box without backorders. |
| Total Recovery Rate | `sum(First + Backorder Shipped) / sum(Demand)` | Cumulative | Percentage of demand eventually fulfilled after backorder replenishment. |
Enter the values for your scenario, verify the units, and run the calculation.
Start by entering the required fields in the Order Fill Rate Analyzer form above.
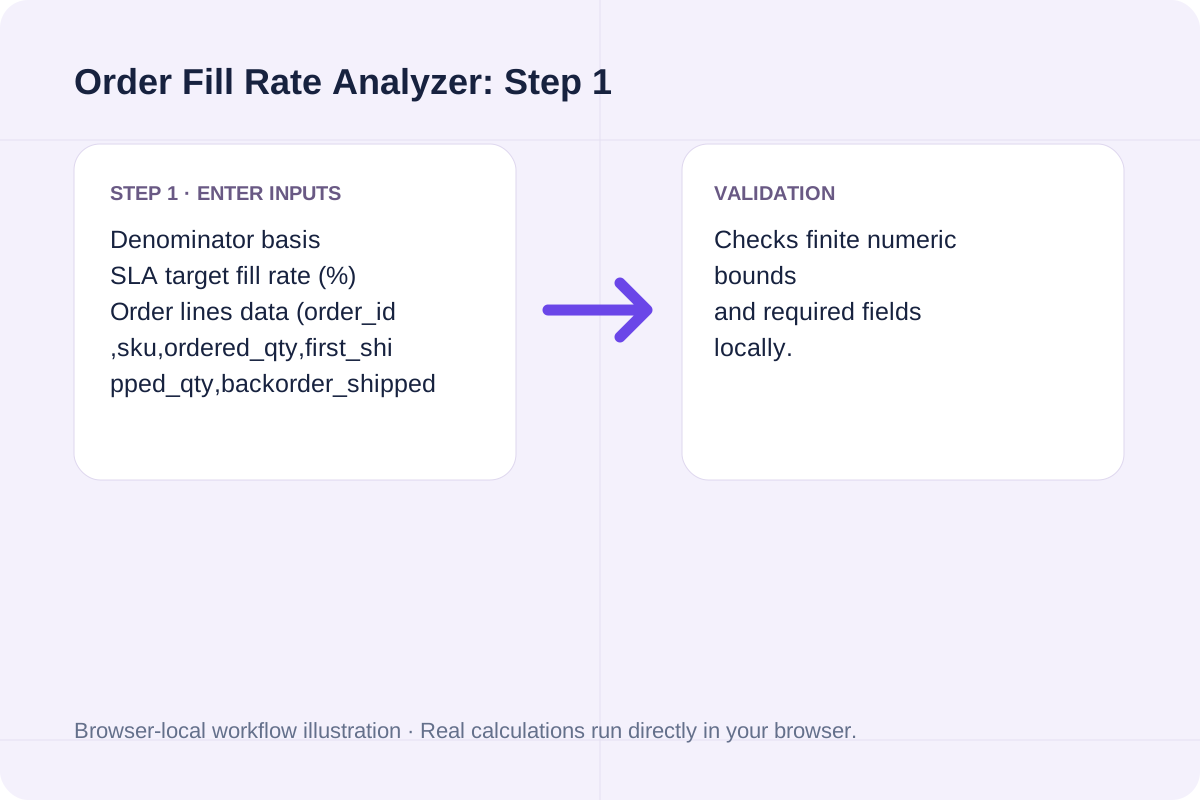
Match each value to the unit or format shown next to the input box before running the calculation.
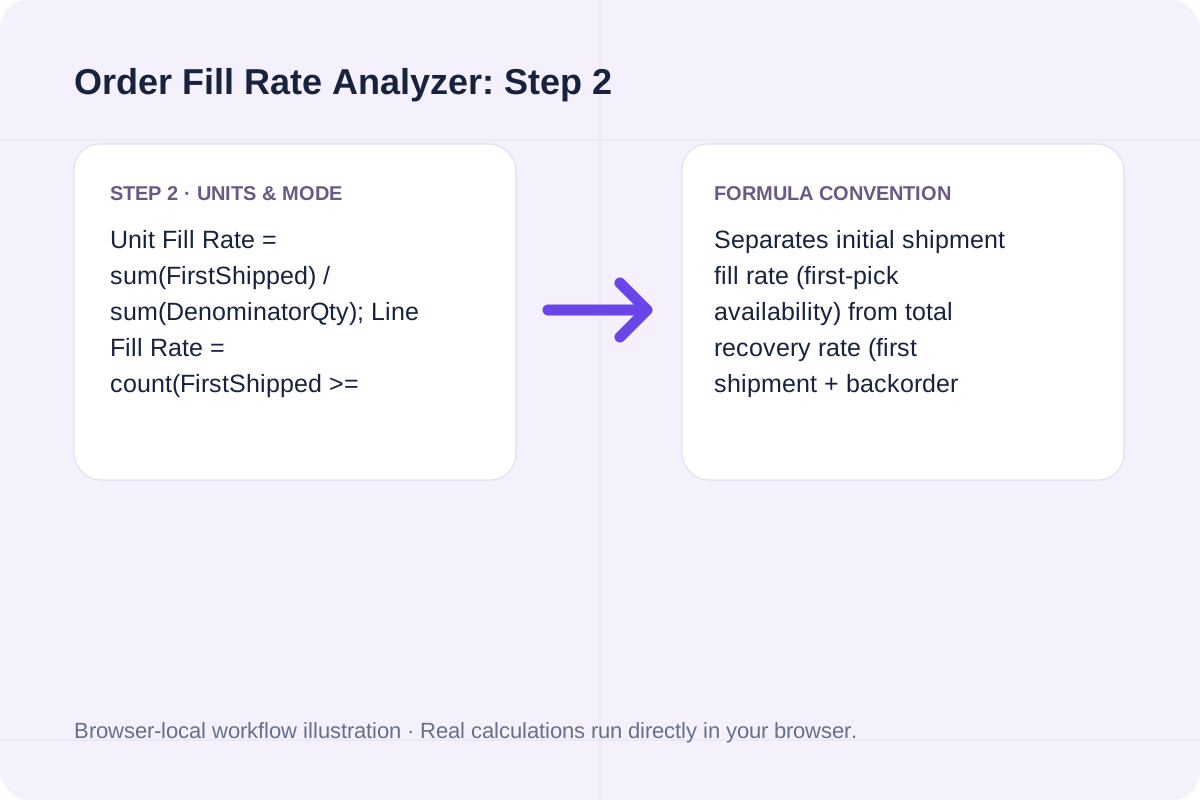
Select Analyze Fill Rate, inspect the primary metric and breakdown cards, then use Copy result or Download result.txt.
Compare baseline and alternative runs for Order Fill Rate Analyzer before exporting the result.
Analyze warehouse fulfillment performance from order line data: compute unit fill rate, line fill rate, order fill rate, and backorder recovery with explicit gross vs. net denominators.
Unit Fill Rate = sum(FirstShipped) / sum(DenominatorQty); Line Fill Rate = count(FirstShipped >= DenominatorQty) / TotalLines; Order Fill Rate = count(AllLinesCompleteOnFirstShip) / TotalOrders.
Separates initial shipment fill rate (first-pick availability) from total recovery rate (first shipment + backorder fulfillment) and never conflates warehouse fill rate with ecommerce checkout conversion.
Review the calculated output alongside your entered parameters and unit conventions.
Separates initial shipment fill rate (first-pick availability) from total recovery rate (first shipment + backorder fulfillment) and never conflates warehouse fill rate with ecommerce checkout conversion.
Avoid common ERP export pitfalls that distort fulfillment KPIs.
Unit Fill Rate = sum(FirstShipped) / sum(DenominatorQty); Line Fill Rate = count(FirstShipped >= DenominatorQty) / TotalLines; Order Fill Rate = count(AllLinesCompleteOnFirstShip) / TotalOrders. Separates initial shipment fill rate (first-pick availability) from total recovery rate (first shipment + backorder fulfillment) and never conflates warehouse fill rate with ecommerce checkout conversion.
Free On-Time In-Full (OTIF / DIFOT) supply chain calculator. Audit order-level and unit-level OT%, IF%, OTIF%, SLA compliance, and failure root causes in your browser.
Open tool
Calculate bottleneck cycle time, Takt time margin, hourly and shift throughput, line balance efficiency, flow efficiency, and Little's Law WIP from workstation times.
Open tool
Analyze manufacturing changeover and setup times using SMED (Single-Minute Exchange of Die). Break down internal vs. external steps, parallel savings, and downtime reduction %.
Open toolChoose another tool for your next calculation, conversion, or text task.

Calculate average chemical reaction rate, reactant consumption rate, apparent rate constant k, and half-life from initial and final molarity and Δt.
Open tool
Calculate room reverberation time (RT60) using Sabine (0.161 V / A) and Norris-Eyring formulas from room volume and surface absorption coefficients.
Open tool
Determine reaction order (0th, 1st, or 2nd) from time-concentration data by linearizing [A], ln[A], and 1/[A] vs. time t, comparing R² and RMSE, and calculating rate constant k and half-life.
Open tool
Calculate CNC milling and turning Metal Removal Rate (MRR in cm³/min and in³/min), estimated spindle power (kW / HP), and chip load.
Open toolAnswers about using Order Fill Rate Analyzer and understanding its results.
Unit (Case) Fill Rate measures total units shipped on the first shipment divided by total units ordered. Line Fill Rate measures the percentage of order lines shipped 100% complete on the first shipment. Order Fill Rate is the strictest metric: an entire multi-line order counts as filled only if every single line in that order ships 100% complete on the first shipment.
If an order contains 5 lines totaling 100 units and 99 units ship on the first shipment (1 unit short on one line), the Unit Fill Rate is 99.0%, the Line Fill Rate is 80.0% (4 of 5 lines complete), and the Order Fill Rate for that order is 0% because the order required a split shipment.
Supply chain teams track both: Net Demand excludes customer-initiated cancellations prior to picking so warehouse inventory isn't penalized for buyer remorse, whereas Gross Demand includes all cancellations when stockouts caused the cancellation.
First-Shipment Fill Rate only counts units dispatched in the initial shipment wave. Total Recovery Fill Rate adds subsequent backorder shipments (FirstShipped + BackorderShipped) divided by demand, showing how much demand was eventually satisfied vs. permanently lost.
Choose another tool for your next calculation, conversion, or text task.