
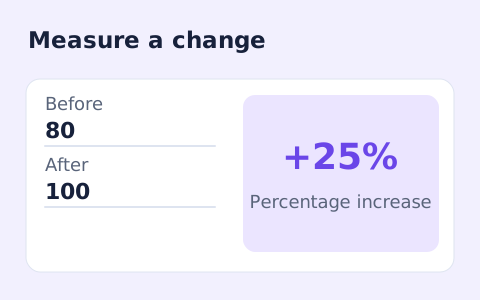
Percent Change Calculator
Calculate percentage change and absolute difference between a positive starting value and a new value.
Open toolFind the compound annual growth rate between a starting and ending value over an entered number of years. Read the smoothed rate alongside total change.
Update the inputs to see your result.
Result will appear here
Two endpoint values and a duration determine a smoothed annual rate.
The ending value is divided by the positive starting value, then raised to the reciprocal of years. Subtracting one gives the smoothed annual rate connecting those endpoints, rather than a record of actual yearly changes.
A smoothed annualized rate. It does not describe year-by-year volatility, cash flows, fees, or taxes.
Prepare a positive starting value, ending value and the duration between those endpoints.
Enter a positive starting value, ending value, and time span in years. Use the same value basis for both endpoints and retain the duration. The calculator has no intermediate deposit or withdrawal fields.
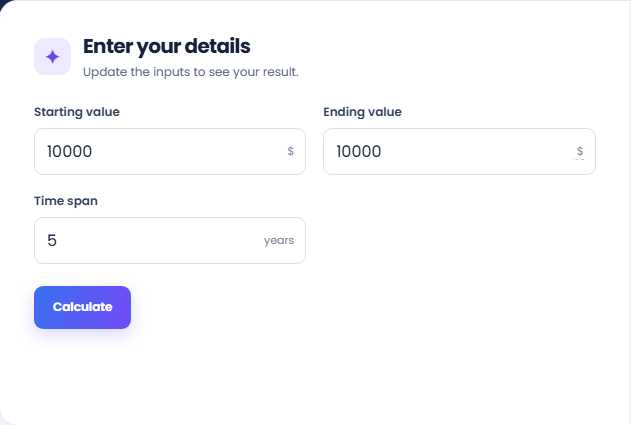
Select Calculate and read the compound annual growth rate. The page finds the constant annual rate that links the endpoint ratio over the duration. This does not show the actual sequence of annual gains or losses within that period.
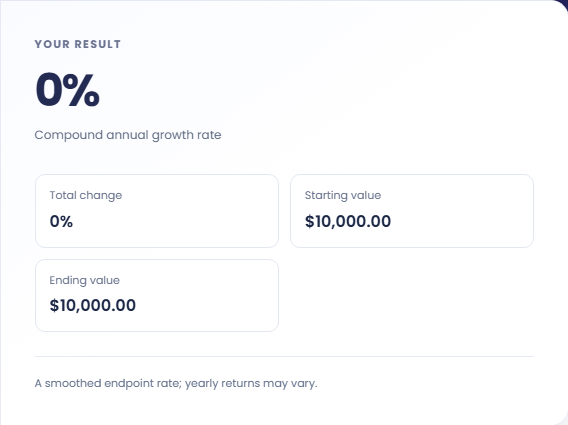
Read Total change, Starting value, and Ending value with the main rate. Total change covers the entire endpoint movement; CAGR annualizes it. Cash-flow timing, fees, taxes, and year-by-year volatility are excluded from this two-endpoint model.
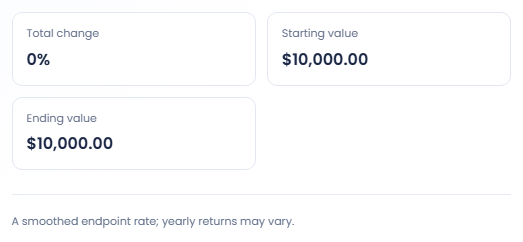
CAGR describes a smoothed rate between endpoints rather than a sequence of yearly returns.
Starting at $10,000 and ending at $15,000 after five years produces a displayed CAGR of about 8.45 percent. The total change is fifty percent. This example separates an annualized endpoint rate from the full period change.

Use the same start and end values with two durations to see why time matters. Reaching one endpoint ratio over fewer years produces a different annualized rate. That comparison says nothing about the fluctuations or cash flows within either period.

An ending value below the starting value can produce a negative annualized result. Review total change with it so the direction remains clear. The tool describes the endpoint relationship and does not identify which years contributed the losses.

Read annualized change alongside total change while retaining the time span.
The annualized percentage is the constant compound rate that connects the entered endpoints over the stated duration. Actual year by year values may vary substantially even when they lead to the same ending amount.
Deposits, withdrawals, fees and taxes are not modelled. If those cash flows affected the endpoint amounts, CAGR alone does not separate their contribution from growth. Keep that boundary with any financial comparison.

Check endpoint consistency and keep intermediate cash flows outside this model.
A zero starting amount cannot provide the intended ratio, and the duration must be positive. Confirm that a five year period was entered as five rather than sixty; the years field is not a months field.
Use Percent Change Calculator for the whole endpoint change without annualisation. Use Compound Interest Calculator for a fixed rate model with monthly deposits. Neither should be substituted silently for an investment return calculation with irregular cash flows.

Calculate percentage change and absolute difference between a positive starting value and a new value.
Open tool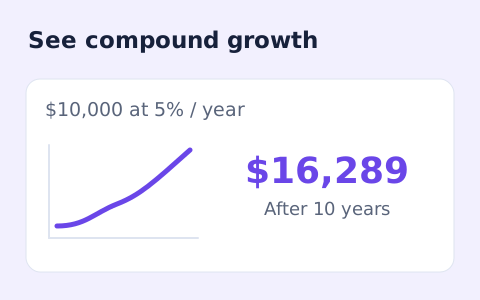
Estimate compound growth from a starting balance, monthly contribution, annual rate, and compound frequency.
Open tool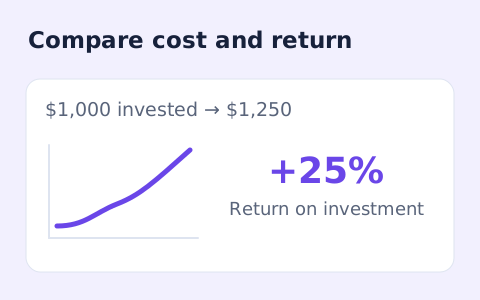
Calculate simple return on investment from the initial cost, final value, additional income, and costs.
Open toolChoose another tool for your next calculation, conversion, or text task.
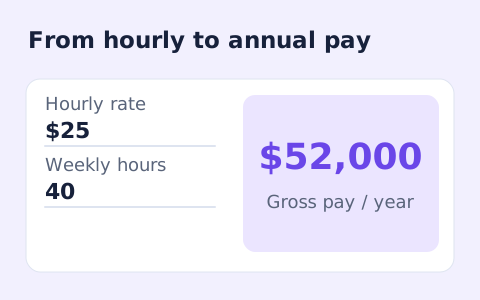
Convert hourly pay to gross annual, monthly, and weekly salary using your own working hours and weeks.
Open tool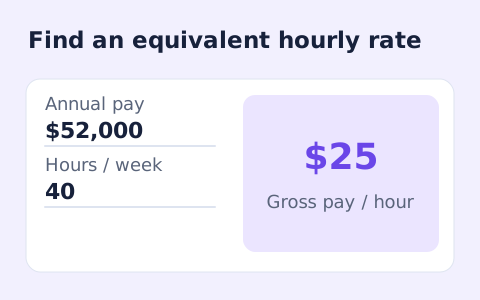
Convert annual gross salary into an hourly rate from your hours per week and paid weeks per year.
Open tool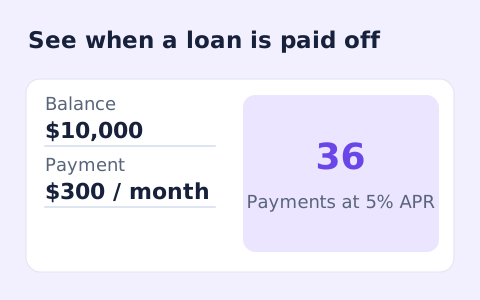
Estimate loan payoff time and interest savings from regular and extra monthly payments.
Open tool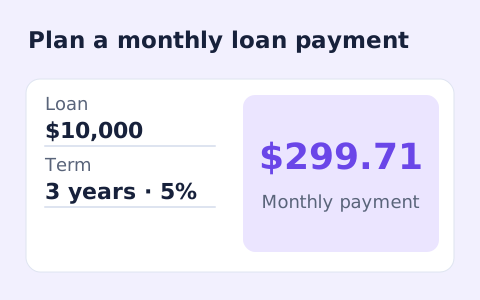
Calculate fixed monthly payments on an amortizing loan using amount, annual rate, and term.
Open toolAnswers about using CAGR Calculator and understanding its results.
Yes. A lower ending value produces a negative annualized rate.
No. It shows the constant annual rate that connects the two endpoint values.
No. It uses only two endpoint values and the time span. Intermediate cash flows need a different return model.
Yes. With a positive starting value, an ending value of zero gives an annualized rate of minus 100 percent under this endpoint formula.
Find the compound annual growth rate between a starting and ending value over an entered number of years.