

Sample Size Calculator for Two Proportions (A/B Test & Fleiss CC)
Free sample size calculator for comparing two independent proportions (p1 vs. p2). Compute unadjusted and Fleiss continuity-corrected n1, n2, total N, and Cohen's h.
Open toolDetermine the exact sample size (`n1`, `n2`, and total `N`) required to detect a target mean difference `Δ` or achieve a margin of error `±E` from your standard deviation `σ`, significance level `α`, statistical power `1 − β`, and group allocation ratio `k = n2 / n1`.
Enter the inputs, then select Calculate Sample Size (n).
Result will appear here
Select your study design and enter the standard deviation and target difference to compute both exact normal-approximation values and upward-rounded integer sample sizes.
Two-Sample Normal Approximation: n1 = ((1 + 1/k) × σ² × (Z_{α} + Z_{β})²) / Δ², n2 = k × n1 (each rounded up via ceil); One-Sample Power: n = ceil((σ × (Z_{α} + Z_{β}) / Δ)²); Single-Mean CI: n = ceil((Z_{α} × σ / E)²).
Computes exact normal-approximation sample sizes and always rounds group counts upward to the next integer (Math.ceil) so target power (1 − β) or margin of error (E) is never under-attained.
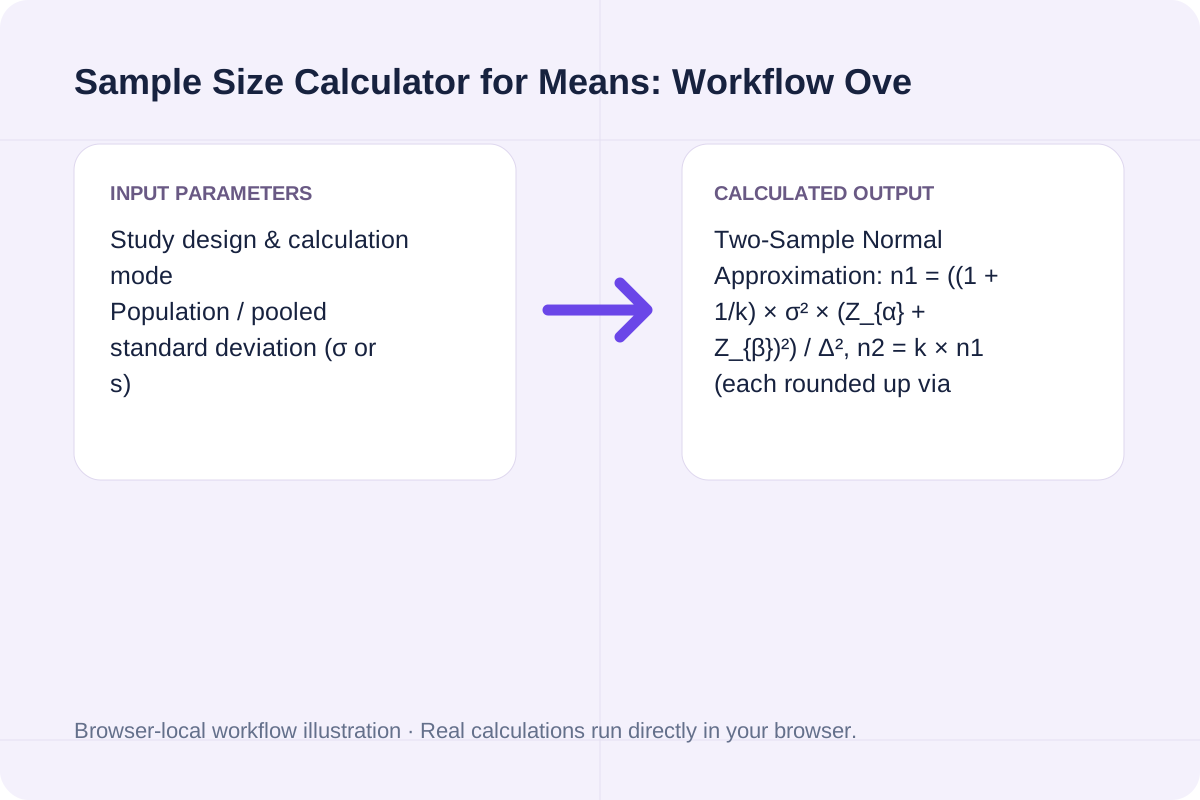
Required sample size per group (`n1 = n2`) and total `N` across common standardized effect sizes (`d = Δ / σ`) and power levels.
| Scenario (σ vs. Δ) | Standardized Effect (d = Δ / σ) | 80% Power (n per group / Total N) | 90% Power (n per group / Total N) | Single-Mean 95% CI (n for ±E) |
|---|---|---|---|---|
| Small Effect (`σ = 15, Δ = 3`) | `d = 0.20` | **393 / group** (`786` total) | **526 / group** (`1,052` total) | `97` (`±3` margin) |
| Default Benchmark (`σ = 15, Δ = 5`) | `d = 0.333` | **142 / group** (`284` total) | **190 / group** (`380` total) | `35` (`±5` margin) |
| Medium Effect (`σ = 15, Δ = 7.5`) | `d = 0.50` | **63 / group** (`126` total) | **85 / group** (`170` total) | `16` (`±7.5` margin) |
| Large Effect (`σ = 15, Δ = 12`) | `d = 0.80` | **25 / group** (`50` total) | **33 / group** (`66` total) | `7` (`±12` margin) |
Enter the values for your scenario, verify the units, and run the calculation.
Start by entering the required fields in the Sample Size Calculator for Means form above.
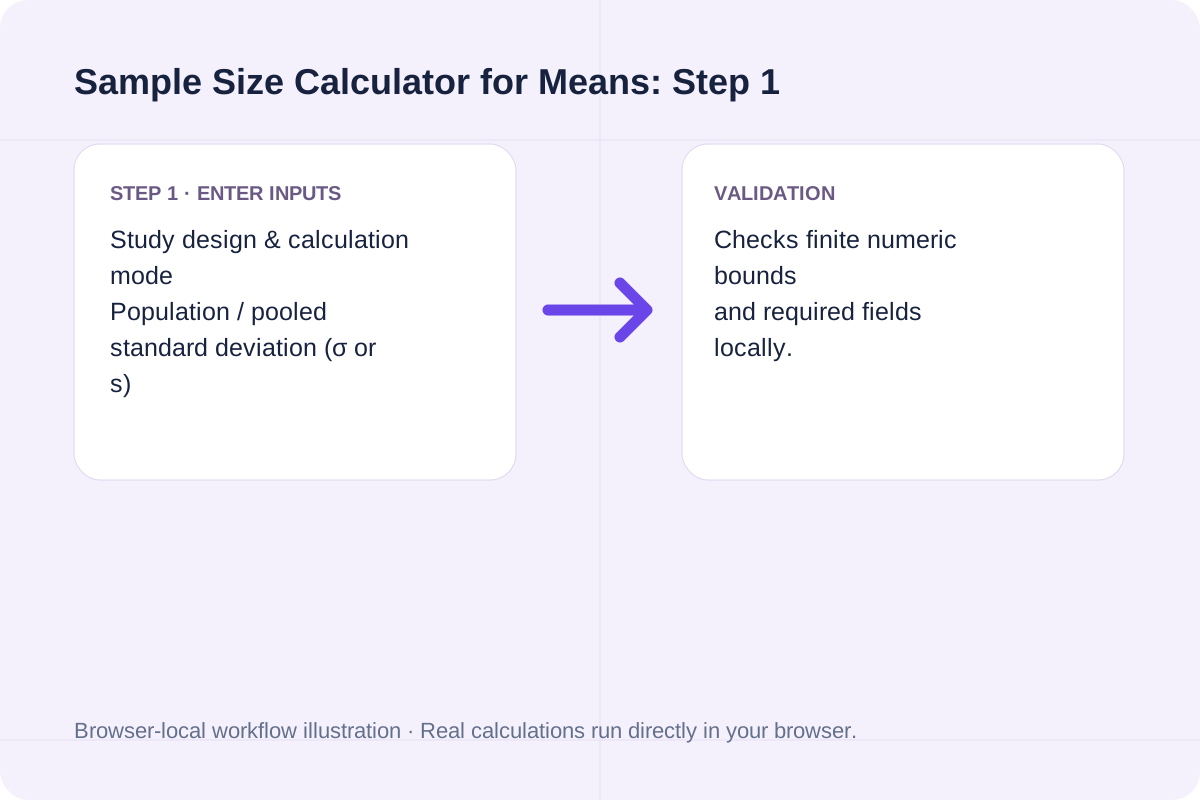
Match each value to the unit or format shown next to the input box before running the calculation.
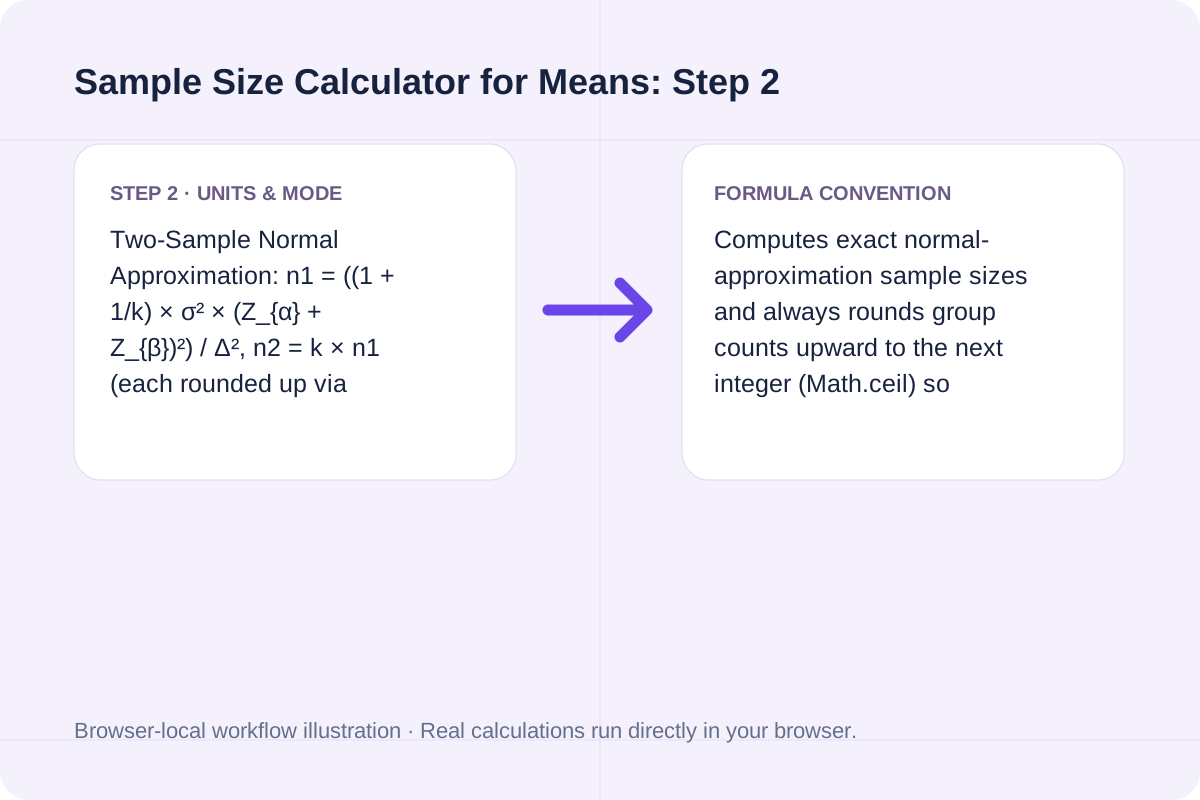
Select Calculate Sample Size (n), inspect the primary metric and breakdown cards, then use Copy result or Download result.txt.
Compare baseline and alternative runs for Sample Size Calculator for Means before exporting the result.
Calculate sample size for comparing two independent means, testing a single mean, or estimating a mean within a target margin of error. Includes Z-approximation, ceiling rounding, and allocation ratio k = n2/n1.
Two-Sample Normal Approximation: n1 = ((1 + 1/k) × σ² × (Z_{α} + Z_{β})²) / Δ², n2 = k × n1 (each rounded up via ceil); One-Sample Power: n = ceil((σ × (Z_{α} + Z_{β}) / Δ)²); Single-Mean CI: n = ceil((Z_{α} × σ / E)²).
Computes exact normal-approximation sample sizes and always rounds group counts upward to the next integer (Math.ceil) so target power (1 − β) or margin of error (E) is never under-attained.
Review the calculated output alongside your entered parameters and unit conventions.
Computes exact normal-approximation sample sizes and always rounds group counts upward to the next integer (Math.ceil) so target power (1 − β) or margin of error (E) is never under-attained.
Verify these three assumptions before finalizing your sample size.
Two-Sample Normal Approximation: n1 = ((1 + 1/k) × σ² × (Z_{α} + Z_{β})²) / Δ², n2 = k × n1 (each rounded up via ceil); One-Sample Power: n = ceil((σ × (Z_{α} + Z_{β}) / Δ)²); Single-Mean CI: n = ceil((Z_{α} × σ / E)²). Computes exact normal-approximation sample sizes and always rounds group counts upward to the next integer (Math.ceil) so target power (1 − β) or margin of error (E) is never under-attained.
Free sample size calculator for comparing two independent proportions (p1 vs. p2). Compute unadjusted and Fleiss continuity-corrected n1, n2, total N, and Cohen's h.
Open tool
Calculate Cohen's d, Hedges' g, Glass's delta, correlation r, 95% confidence interval, and Cohen's U3 / CLES from group means, standard deviations, and sample sizes.
Open tool
Free Kaplan-Meier survival calculator. Compute product-limit survival S(t), Greenwood variance, log-log or linear confidence intervals, median survival time, and risk-set tables in your browser.
Open toolChoose another tool for your next calculation, conversion, or text task.

Calculate bottleneck cycle time, Takt time margin, hourly and shift throughput, line balance efficiency, flow efficiency, and Little's Law WIP from workstation times.
Open tool
Calculate Dynamic Time Warping (DTW) distance and optimal alignment path between two time series in your browser. Supports absolute, squared, and root-squared costs plus Sakoe-Chiba window band.
Open tool
Calculate the Mantel-Cox log-rank test statistic (chi-square, df = 1), p-value, observed vs. expected events, hypergeometric variance, and hazard ratio from censored survival data.
Open tool
Detect multiple change points and regime shifts in a numeric time series using exact O(N^2) dynamic programming (BIC, AIC, or custom penalty) and CUSUM statistics.
Open toolAnswers about using Sample Size Calculator for Means and understanding its results.
In power analysis and confidence interval planning, a fractional sample size such as n1 = 141.18 means 141 participants would deliver slightly less than the target 80% power (or a slightly wider margin of error than E). Rounding up to the next whole integer (ceil(141.18) = 142 per group, 284 total) guarantees your study meets or exceeds the specified statistical power.
An equal 1:1 allocation (k = 1) minimizes the total number of participants required for a given effect size Δ and standard deviation σ. When you use an unequal split—such as k = 2 (twice as many controls as treated subjects)—Group 1 requires fewer subjects (n1 drops by 25%), but the combined total N = n1 + n2 increases by 12.5% because the variance factor (1 + 1/k)(1 + k) is minimized at k = 1.
The standardized effect size is Cohen's d = Δ / σ. Because sample size scales with the inverse square of Cohen's d (n ∝ (σ / Δ)² = 1 / d²), cutting your minimum detectable difference Δ in half (or doubling the standard deviation σ) quadruples the required sample size.
The formula outputs the net analyzable sample size (completers). If your clinical trial, survey, or longitudinal experiment expects an attrition rate r (for example, 15% dropout), divide the calculated integer N by (1 − r): N_enrolled = ceil(N / (1 − 0.15)).
Choose another tool for your next calculation, conversion, or text task.