AI Tools Free

Log-Rank Test Calculator (Mantel-Cox Survival Analysis)

Test whether two right-censored time-to-event curves differ significantly: compute pooled risk sets, observed vs. expected events (`O_1`, `E_1`, `O_2`, `E_2`), exact hypergeometric variance (`V_1`), Mantel-Cox `chi^2` (`df = 1`), two-sided `p`-value, and Hazard Ratio.

Free to useNo sign-upRuns in your browser
Enter your details

Enter the inputs, then select Calculate Log-Rank Test.

Enter one observation per line as: time, status (1 = event/failure, 0 = right-censored), group label (exactly 2 distinct groups).

Standard un-corrected Mantel-Cox matches R survival::survdiff(rho = 0) and Python lifelines.

Two-sided alpha threshold used to evaluate the null hypothesis H0: S_1(t) = S_2(t).

Your result
Enter your details

Result will appear here

How the Mantel-Cox Log-Rank Test Is Calculated

The log-rank test treats each distinct failure timestamp `t_j` as a `2 x 2` contingency table conditioned on the number of subjects still at risk just prior to `t_j`.

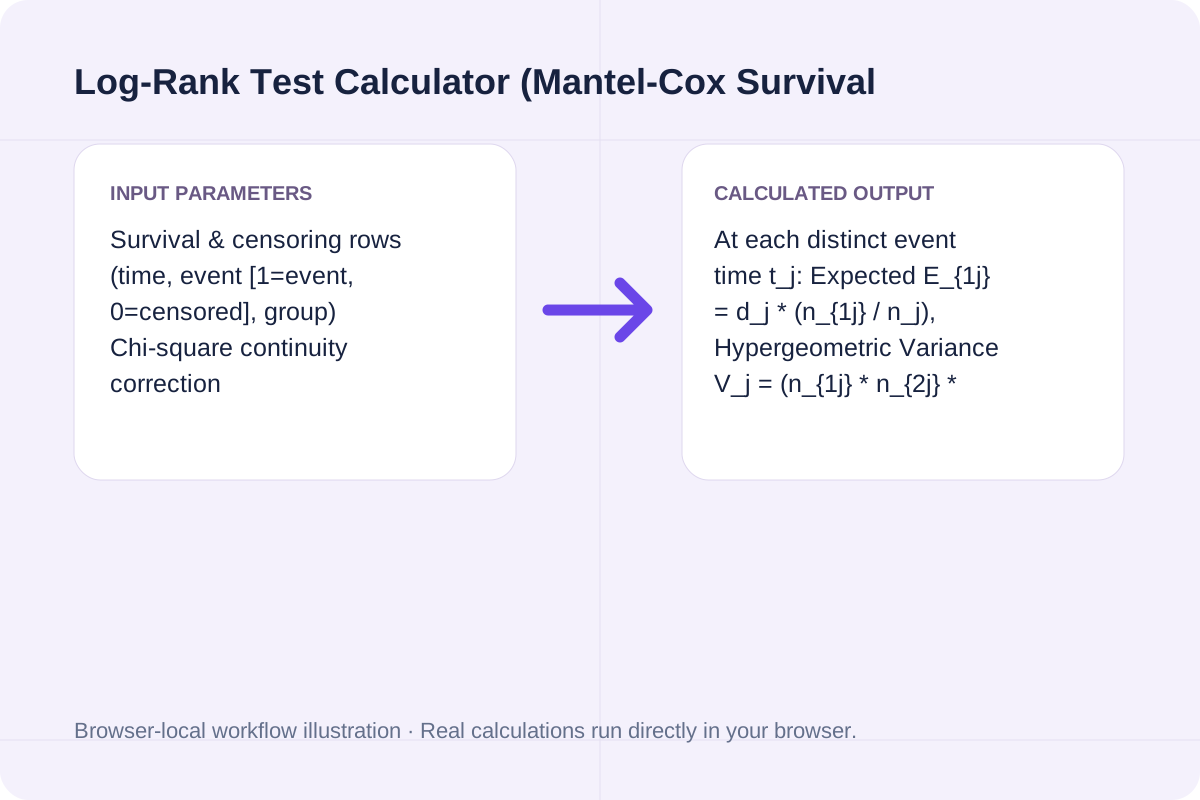
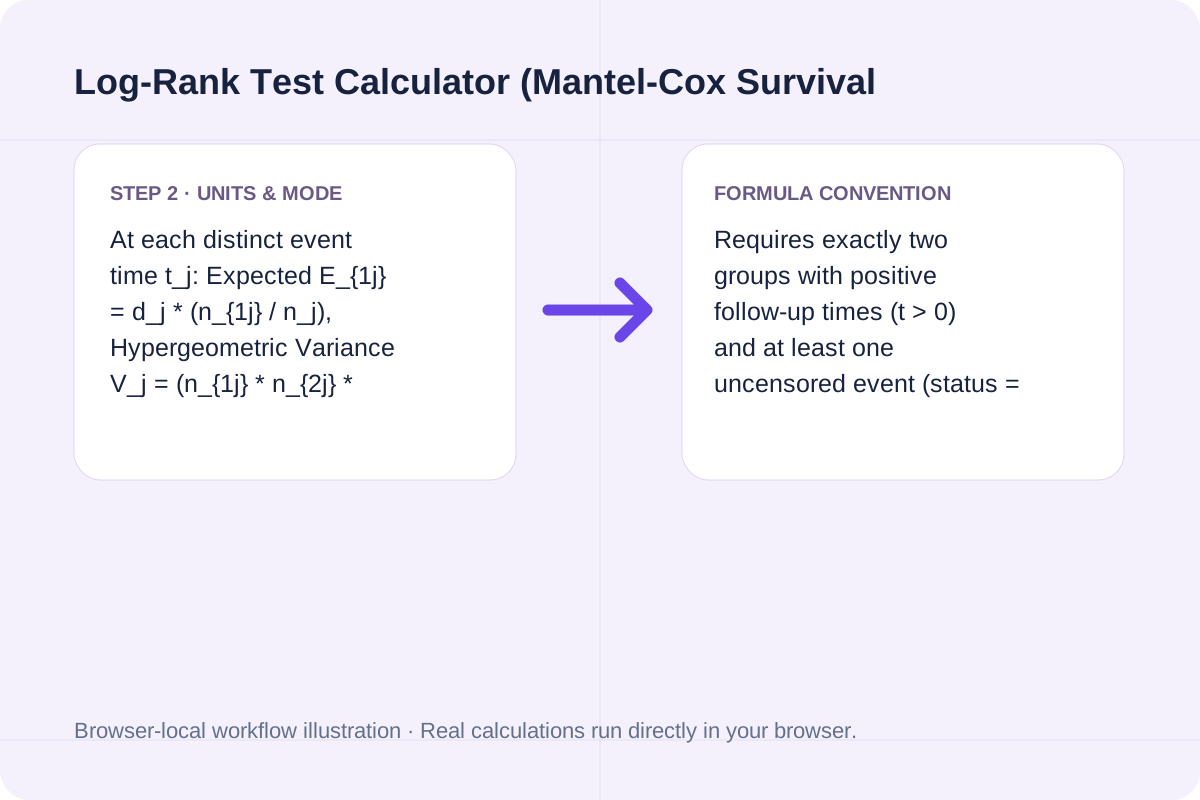
At each distinct event time t_j: Expected E_{1j} = d_j * (n_{1j} / n_j), Hypergeometric Variance V_j = (n_{1j} * n_{2j} * d_j * (n_j - d_j)) / (n_j^2 * (n_j - 1)); Log-Rank Statistic chi^2 = (sum(O_{1j} - E_{1j}))^2 / sum(V_j) with df = 1; Mantel-Haenszel Hazard Ratio HR = (O_1 / E_1) / (O_2 / E_2).

Requires exactly two groups with positive follow-up times (t > 0) and at least one uncensored event (status = 1). Assumes non-informative right censoring and proportional hazards across follow-up.

Log-Rank Test Calculator (Mantel-Cox Survival Analysis) workflow overview
Workflow overview for Log-Rank Test Calculator (Mantel-Cox Survival Analysis).

Log-Rank (Mantel-Cox) Critical Values & Benchmark Reference Table

Chi-square critical thresholds (`df = 1`), hazard ratio interpretation, and exact risk-set outputs for the default 12-subject dataset.

Metric / ScenarioFormula / RuleDefault Dataset Value (`Group A` vs `Group B`)Statistical Interpretation
**Group 1 Observed vs. Expected (`O_1`, `E_1`)**`O_1 = sum(d_{1j})`, `E_1 = sum(d_j * n_{1j} / n_j)``O_1 = 5.00`, `E_1 = 2.1069`Group A had 2.8931 more events than expected under `H_0`
**Group 2 Observed vs. Expected (`O_2`, `E_2`)**`O_2 = sum(d_{2j})`, `E_2 = sum(d_j * n_{2j} / n_j)``O_2 = 3.00`, `E_2 = 5.8931`Group B had 2.8931 fewer events than expected under `H_0`
**Pooled Hypergeometric Variance (`V_1`)**`sum((n_{1j}*n_{2j}*d_j*(n_j-d_j)) / (n_j^2*(n_j-1)))``V_1 = 1.2509` across `7` distinct event timesAccounts for tied failures at `t = 10` (`d = 2`)
**Mantel-Cox Chi-Square & p-Value**`chi^2 = (O_1 - E_1)^2 / V_1`, `p = erfc(sqrt(chi^2 / 2))``chi^2 = 6.6911` (`df = 1`), `p = 0.0097`Rejects `H_0` at both `alpha = 0.05` and `alpha = 0.01`
**Pike / Mantel-Haenszel Hazard Ratio (`HR`)**`HR = (O_1 / E_1) / (O_2 / E_2)``HR = 4.6617` (`A vs. B`)Group A hazard rate is `4.66x` higher than Group B

How to use Log-Rank Test Calculator (Mantel-Cox Survival Analysis) step by step

Enter the values for your scenario, verify the units, and run the calculation.

Enter the inputs

Start by entering the required fields in the Log-Rank Test Calculator (Mantel-Cox Survival Analysis) form above.

Log-Rank Test Calculator (Mantel-Cox Survival Analysis) step 1: Enter the inputs
Step 1 workflow overview for Log-Rank Test Calculator (Mantel-Cox Survival Analysis).

Verify units and assumptions

Match each value to the unit or format shown next to the input box before running the calculation.

Log-Rank Test Calculator (Mantel-Cox Survival Analysis) step 2: Verify units and assumptions
Step 2 workflow overview for Log-Rank Test Calculator (Mantel-Cox Survival Analysis).

Run and export your result

Select Calculate Log-Rank Test, inspect the primary metric and breakdown cards, then use Copy result or Download result.txt.

Log-Rank Test Calculator (Mantel-Cox Survival Analysis) step 3: Run and export your result
Step 3 workflow overview for Log-Rank Test Calculator (Mantel-Cox Survival Analysis).

Worked examples for Log-Rank Test Calculator (Mantel-Cox Survival Analysis)

Compare baseline and alternative runs for Log-Rank Test Calculator (Mantel-Cox Survival Analysis) before exporting the result.

Baseline example

Calculate the Mantel-Cox log-rank test statistic (chi-square, df = 1), p-value, observed vs. expected events, hypergeometric variance, and hazard ratio from censored survival data.

Log-Rank Test Calculator (Mantel-Cox Survival Analysis) example 1: Baseline example
Worked example 1 for Log-Rank Test Calculator (Mantel-Cox Survival Analysis).

Comparison scenario

At each distinct event time t_j: Expected E_{1j} = d_j * (n_{1j} / n_j), Hypergeometric Variance V_j = (n_{1j} * n_{2j} * d_j * (n_j - d_j)) / (n_j^2 * (n_j - 1)); Log-Rank Statistic chi^2 = (sum(O_{1j} - E_{1j}))^2 / sum(V_j) with df = 1; Mantel-Haenszel Hazard Ratio HR = (O_1 / E_1) / (O_2 / E_2).

Log-Rank Test Calculator (Mantel-Cox Survival Analysis) example 2: Comparison scenario
Worked example 2 for Log-Rank Test Calculator (Mantel-Cox Survival Analysis).

Boundary check before exporting

Requires exactly two groups with positive follow-up times (t > 0) and at least one uncensored event (status = 1). Assumes non-informative right censoring and proportional hazards across follow-up.

Log-Rank Test Calculator (Mantel-Cox Survival Analysis) example 3: Boundary check before exporting
Worked example 3 for Log-Rank Test Calculator (Mantel-Cox Survival Analysis).

How to interpret the Log-Rank Test Calculator (Mantel-Cox Survival Analysis) output

Review the calculated output alongside your entered parameters and unit conventions.

Requires exactly two groups with positive follow-up times (t > 0) and at least one uncensored event (status = 1). Assumes non-informative right censoring and proportional hazards across follow-up.

How to interpret Log-Rank Test Calculator (Mantel-Cox Survival Analysis) results
Result interpretation guide for Log-Rank Test Calculator (Mantel-Cox Survival Analysis).

Pre-Analysis Survival Data Checklist

Confirm these three formatting rules before running your test.

At each distinct event time t_j: Expected E_{1j} = d_j * (n_{1j} / n_j), Hypergeometric Variance V_j = (n_{1j} * n_{2j} * d_j * (n_j - d_j)) / (n_j^2 * (n_j - 1)); Log-Rank Statistic chi^2 = (sum(O_{1j} - E_{1j}))^2 / sum(V_j) with df = 1; Mantel-Haenszel Hazard Ratio HR = (O_1 / E_1) / (O_2 / E_2). Requires exactly two groups with positive follow-up times (t > 0) and at least one uncensored event (status = 1). Assumes non-informative right censoring and proportional hazards across follow-up.

Scope limits and assumptions for Log-Rank Test Calculator (Mantel-Cox Survival Analysis)
Assumptions and input boundaries for Log-Rank Test Calculator (Mantel-Cox Survival Analysis).

Frequently Asked Questions About the Log-Rank Test

Answers about using Log-Rank Test Calculator (Mantel-Cox Survival Analysis) and understanding its results.

How does the Mantel-Cox log-rank test handle right-censored observations (status = 0)?

Right-censored subjects (patients lost to follow-up or still event-free when the study ends, coded with status = 0) do not trigger an event row of their own, but they remain in the at-risk set n_{1j} or n_{2j} for every event time t_j less than or equal to their censoring time. Once time passes their censored timestamp, they drop out of subsequent at-risk denominators.

Why use the hypergeometric variance V_j instead of the simpler (O1 - E1)^2 / E1 approximation?

The exact Mantel-Cox variance V_j = (n_{1j} * n_{2j} * d_j * (n_j - d_j)) / (n_j^2 * (n_j - 1)) accounts for tied events at the same timestamp t_j and finite-population sampling without replacement from the risk set n_j. Summing V_j across all event times reproduces the exact test statistic output by R survival::survdiff and SAS PROC LIFETEST.

How do I interpret the Log-Rank Hazard Ratio HR = (O1 / E1) / (O2 / E2)?

The ratio O_1 / E_1 measures the relative event rate in Group 1 compared to the null expectation under identical survival curves. Dividing (O_1 / E_1) by (O_2 / E_2) gives the Pike / Mantel-Haenszel hazard ratio estimate: HR > 1 means Group 1 experiences events at a higher hazard rate than Group 2, while HR < 1 indicates a lower hazard rate in Group 1.

When can the log-rank test lose statistical power?

Because the log-rank test weights every distinct event time equally (weight w_j = 1), it is maximally powerful when the two hazard functions stay proportional over time. If the two survival curves cross mid-study (for example, high early surgical risk followed by better late survival), positive and negative (O_{1j} - E_{1j}) terms cancel out.

Try your own values

Choose another tool for your next calculation, conversion, or text task.

Calculate Log-Rank Test