

Change Point Detector (PELT / Optimal Partitioning & CUSUM)
Detect multiple change points and regime shifts in a numeric time series using exact O(N^2) dynamic programming (BIC, AIC, or custom penalty) and CUSUM statistics.
Open toolEvaluate any sequential time series for a monotonic upward or downward trend: compute the Mann-Kendall `S` statistic, tie-adjusted variance `Var(S)`, continuity-corrected `Z_MK`, two-sided `p`-value, Kendall's `tau`, and the outlier-resistant Theil-Sen median slope.
Enter the inputs, then select Run Mann-Kendall Trend Test.
Result will appear here
Recommended by the US Geological Survey (USGS), World Meteorological Organization (WMO), and US EPA for hydrological, climate, and KPI time series, the Mann-Kendall test compares every earlier observation x_i with every later observation x_j (j > i).
S = (# positive pairs) - (# negative pairs); Var(S) = (n(n-1)(2n+5) - sum t_p(t_p-1)(2t_p+5)) / 18; Sen Slope = median((x_j - x_i) / (j - i)).
To test whether your time series contains a sudden step change rather than a smooth trend, run our Change Point Detector (/tools/change-point-detector).
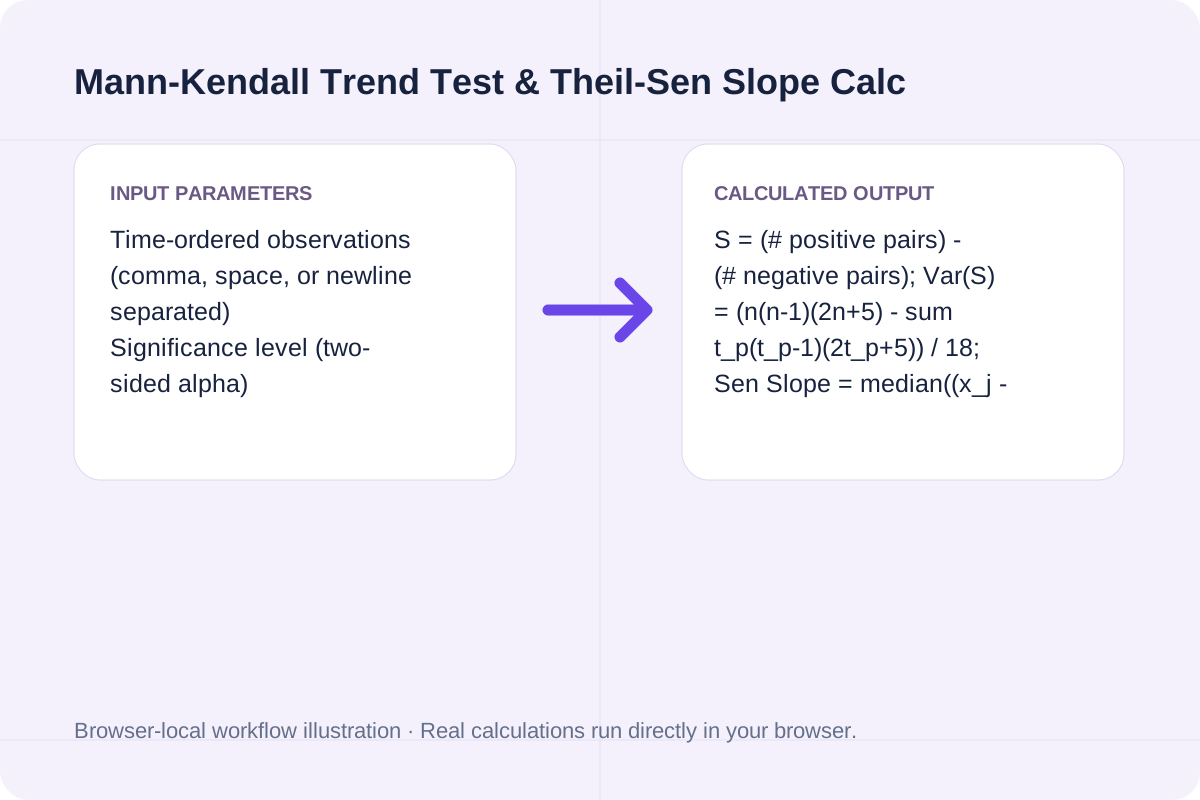
Formulas, tie-correction terms, and exact outputs for the default 10-point environmental monitoring series.
| Statistic / Parameter | Mathematical Definition | Default 10-Point Series Output | Trend Interpretation |
|---|---|---|---|
| Mann-Kendall Score (`S`) | `sum_{i<j} sgn(x_j - x_i)` across `45` pairs | `S = +42` (`43` pos, `1` neg, `1` tie) | Strong positive concordance across time pairs |
| Tie-Corrected Variance `Var(S)` | `[n(n-1)(2n+5) - sum t_p(t_p-1)(2t_p+5)] / 18` | `Var(S) = 124.0000` (`SD = 11.1355`) | Accounts for the 2-element tie at `14.8` (`-18/18 = -1`) |
| Continuity-Corrected `Z_MK` & `p` | `(S - 1) / sqrt(Var(S))` | `Z = +3.6819`, `p = 0.0002` | Statistically significant upward trend (`p < 0.05`) |
| Kendall's Rank Correlation (`tau`) | `S / [n(n - 1) / 2]` | `tau = +0.9333` | Near-monotonic upward rank progression (`-1` to `+1`) |
| Theil-Sen Robust Slope (`beta`) | `median_{i<j} ((x_j - x_i) / (j - i))` | `+0.6000` units / step | Median rate of change per time step (robust to outliers) |
Test any chronological sequence of 4 to 500 measurements in your browser.
Enter your measurements in chronological order (separated by commas, spaces, or newlines). No normality assumption is required, and tied values are detected automatically.
Pick alpha = 0.05 (95% confidence), 0.01, or 0.10, and choose whether to apply the standard +-1 continuity correction when converting S into Z_MK.
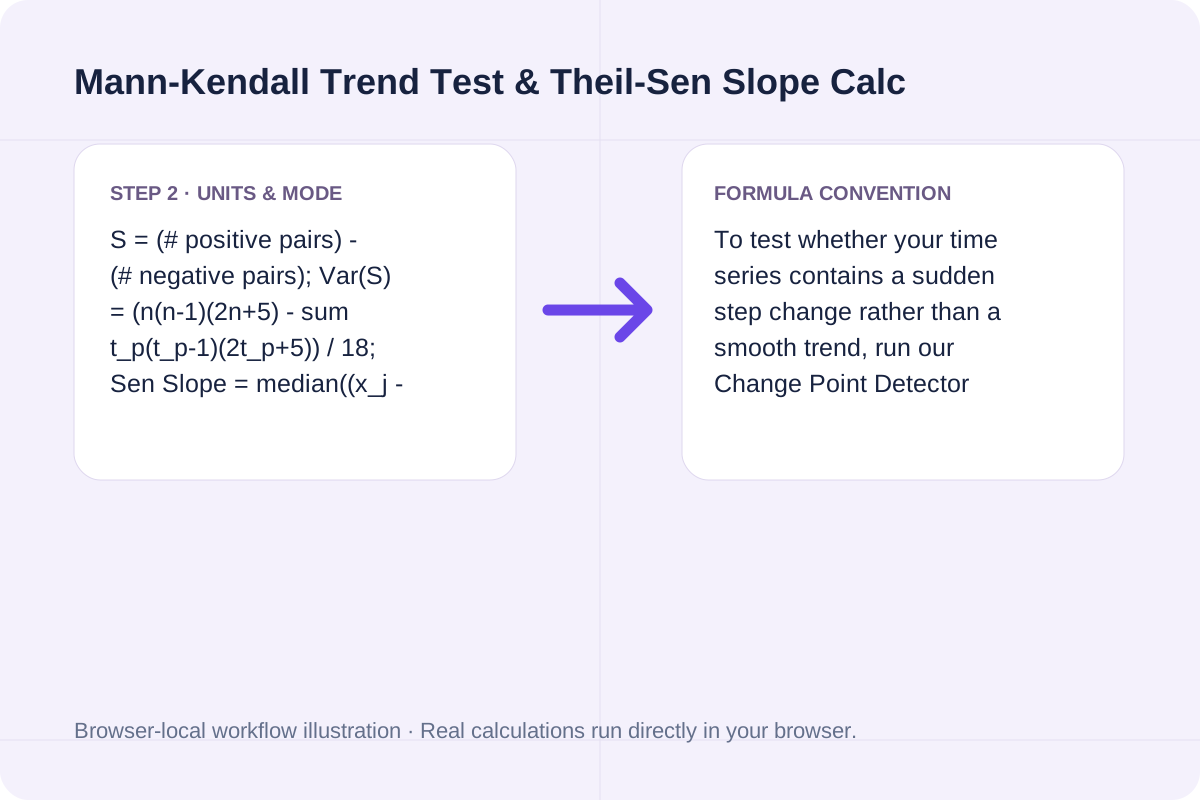
Check the trend verdict (Increasing, Decreasing, or No Significant Trend) alongside the Theil-Sen median slope and intercept for robust forecasting.
See how the non-parametric test handles ties, outliers, and stationary noise.
Free Mann-Kendall trend test calculator with Theil-Sen slope estimator. Compute S statistic, tie-corrected Var(S), continuity-corrected Z, p-value, and Kendall's tau in your browser.
S = (# positive pairs) - (# negative pairs); Var(S) = (n(n-1)(2n+5) - sum t_p(t_p-1)(2t_p+5)) / 18; Sen Slope = median((x_j - x_i) / (j - i)).
To test whether your time series contains a sudden step change rather than a smooth trend, run our Change Point Detector (/tools/change-point-detector).
Use the sign of S and Z_MK for direction, the p-value for significance, and Sen's slope for practical magnitude.
A positive S and Z_MK indicate an upward trend, while a negative S and Z_MK indicate a downward trend. When |Z_MK| exceeds the critical normal value (1.9600 at alpha = 0.05, two-sided), you reject the null hypothesis of no monotonic trend.
Kendall's tau normalizes S by the total number of pairs n(n - 1)/2 so values always lie in [-1, +1]. Pair tau with the Theil-Sen slope beta (change per index step) to report both rank consistency and physical rate of change.
Check these time-series conditions before reporting Mann-Kendall p-values.
1. Positive Autocorrelation (AR(1)): Strong positive lag-1 autocorrelation inflates false-positive rates in raw Mann-Kendall tests; aggregate high-frequency readings into annual or monthly blocks or pre-whiten the series first.
2. Seasonal Cycles: Compare like-for-like seasons (e.g., every July vs. July) so regular seasonal swings do not mask or mimic a long-term trend.
Detect multiple change points and regime shifts in a numeric time series using exact O(N^2) dynamic programming (BIC, AIC, or custom penalty) and CUSUM statistics.
Open tool
Calculate Dynamic Time Warping (DTW) distance and optimal alignment path between two time series in your browser. Supports absolute, squared, and root-squared costs plus Sakoe-Chiba window band.
Open tool
Free sample size calculator for comparing two independent proportions (p1 vs. p2). Compute unadjusted and Fleiss continuity-corrected n1, n2, total N, and Cohen's h.
Open toolChoose another tool for your next calculation, conversion, or text task.

Calculate sample size for comparing two independent means, testing a single mean, or estimating a mean within a target margin of error. Includes Z-approximation, ceiling rounding, and allocation ratio k = n2/n1.
Open tool
Calculate the Mantel-Cox log-rank test statistic (chi-square, df = 1), p-value, observed vs. expected events, hypergeometric variance, and hazard ratio from censored survival data.
Open tool
Free Kaplan-Meier survival calculator. Compute product-limit survival S(t), Greenwood variance, log-log or linear confidence intervals, median survival time, and risk-set tables in your browser.
Open tool
Calculate Cohen's d, Hedges' g, Glass's delta, correlation r, 95% confidence interval, and Cohen's U3 / CLES from group means, standard deviations, and sample sizes.
Open toolAnswers about using Mann-Kendall Trend Test & Theil-Sen Slope Calculator and understanding its results.
The Mann-Kendall test is a rank-based, distribution-free test that evaluates whether a time series exhibits a statistically significant monotonic upward or downward trend over time, without requiring linear increments or normally distributed residuals.
When observations share identical values, pairwise differences x_j - x_i equal zero and contribute 0 to S. For each tie group p containing t_p identical values, the variance formula subtracts t_p(t_p - 1)(2t_p + 5) / 18 from the untied variance n(n - 1)(2n + 5) / 18.
While the Mann-Kendall Z-score and p-value tell you whether a monotonic trend is statistically significant, they do not measure its rate of change. The Theil-Sen estimator takes the median of all n(n - 1)/2 pairwise slopes (x_j - x_i)/(j - i), providing an outlier-resistant slope with a 29.3% breakdown point.
If a series jumps suddenly from one plateau to another, pair the Mann-Kendall test with our Change Point Detector (/tools/change-point-detector) to locate structural breakpoints before fitting segment trends.
Choose another tool for your next calculation, conversion, or text task.