

Spaced Repetition & FSRS Calculator
Calculate daily new flashcards, peak review load, study minutes, and FSRS v4.5/v5 vs. Anki SM-2 intervals from total cards, exam days, and desired retention.
Open toolLog your daily or weekly app minutes and device pickups to calculate total screen time (`Xh Ym`), daily budget surplus or overage, productive focus vs. social/entertainment share, average session duration per pickup, and annualized waking days.
Enter the inputs, then select Analyze Screen Time.
Result will appear here
Paste your app rows (`App Name, Category, Minutes, Pickups`) from iOS Screen Time, Android Digital Wellbeing, or desktop RescueTime / ActivityWatch.
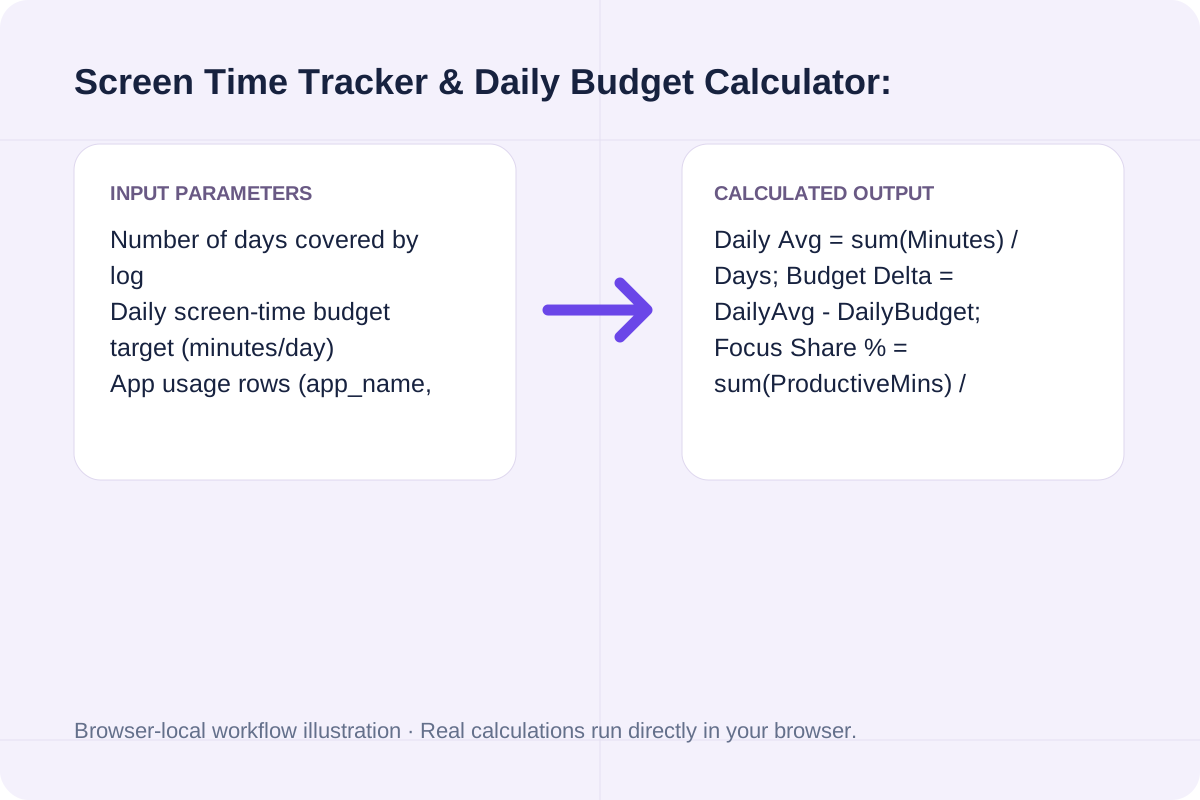
Daily Avg = sum(Minutes) / Days; Budget Delta = DailyAvg - DailyBudget; Focus Share % = sum(ProductiveMins) / sum(TotalMins) * 100; Avg Session = TotalMins / max(1, TotalPickups).
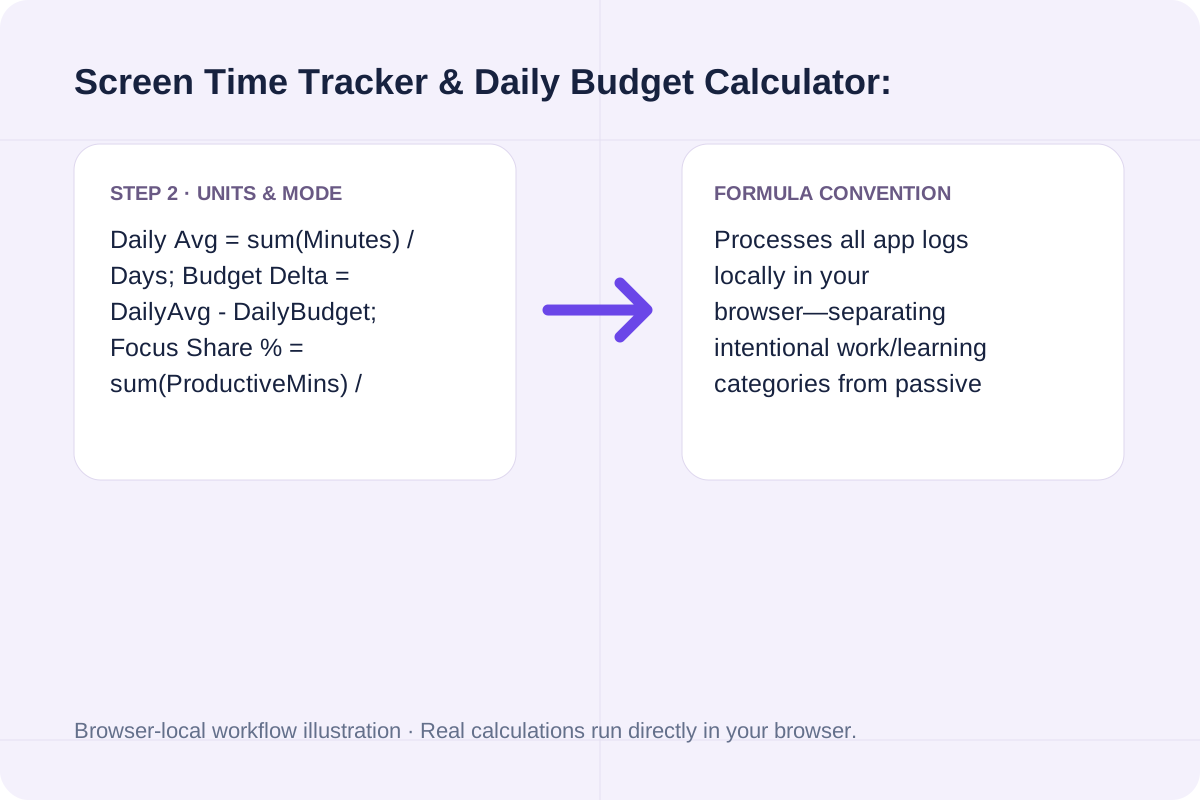
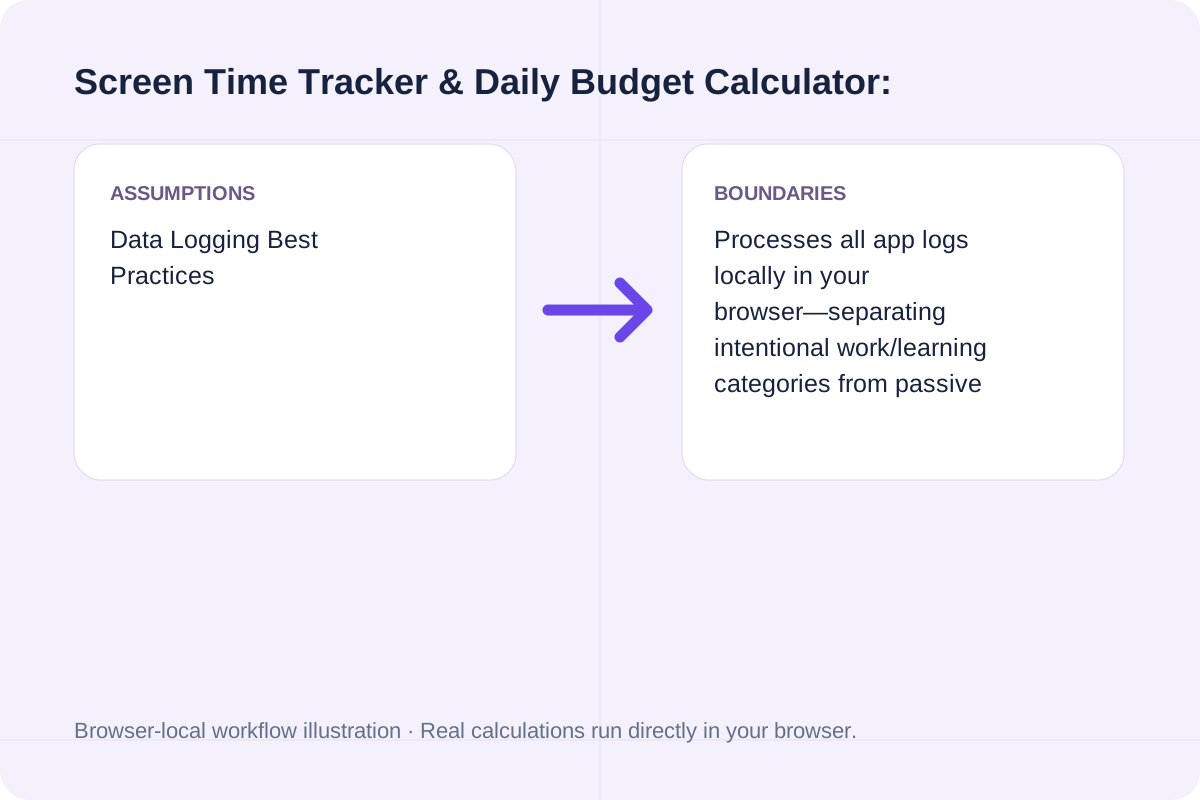
Processes all app logs locally in your browser—separating intentional work/learning categories from passive social/entertainment scroll time and projecting annual waking-life impact.
See how daily screen-time minutes translate into annual hours and 16-hour waking days per year.
| Daily Screen Time | Weekly Total | Annual Hours (365d) | Equivalent 16h Waking Days/Yr | Typical Usage Profile |
|---|---|---|---|---|
| `90 min/day` (`1h 30m`) | `10.5 hrs/wk` | `547.5 hrs/yr` | `34.2 waking days` | Minimalist utility & messaging only |
| `180 min/day` (`3h 00m`) | `21.0 hrs/wk` | `1,095.0 hrs/yr` | `68.4 waking days` | Balanced daily digital budget target |
| `255 min/day` (`4h 15m`) | `29.8 hrs/wk` | `1,551.3 hrs/yr` | `97.0 waking days` | Mixed work communication + evening video/social |
| `360 min/day` (`6h 00m`) | `42.0 hrs/wk` | `2,190.0 hrs/yr` | `136.9 waking days` | Heavy multi-platform social & streaming |
Enter the values for your scenario, verify the units, and run the calculation.
Start by entering the required fields in the Screen Time Tracker & Daily Budget Calculator form above.
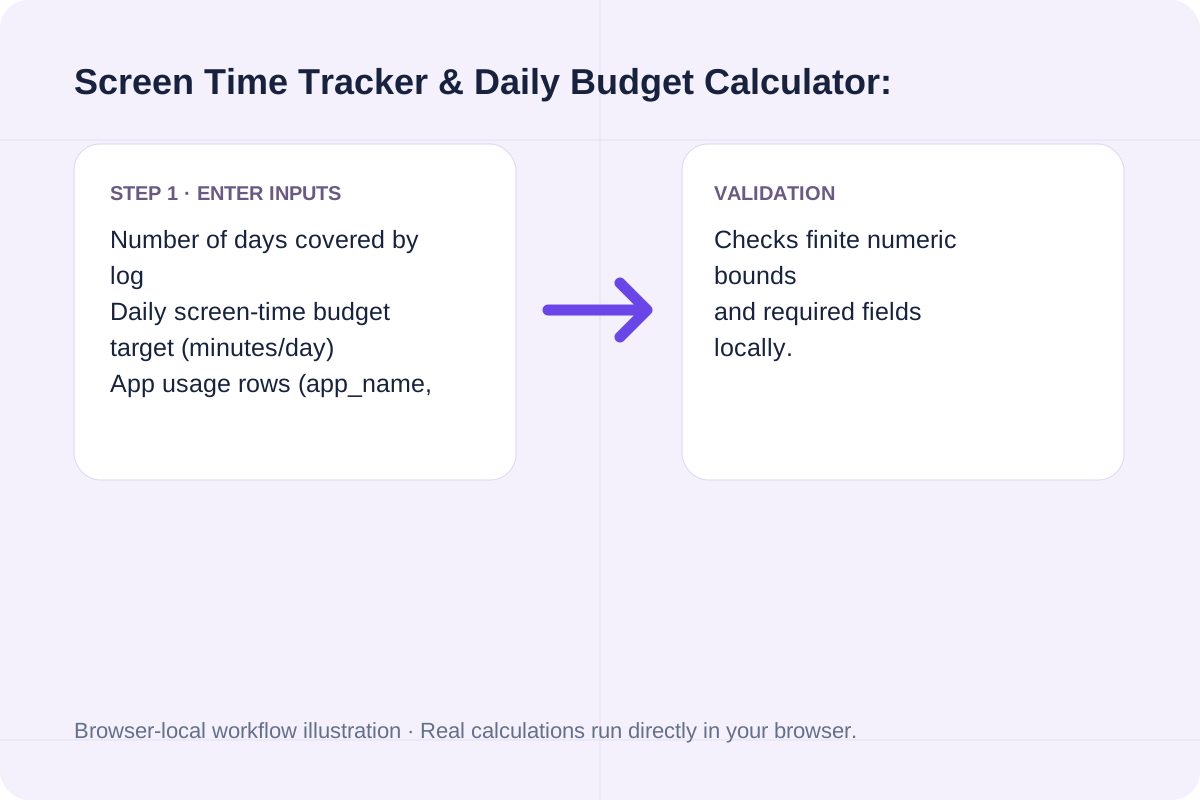
Match each value to the unit or format shown next to the input box before running the calculation.
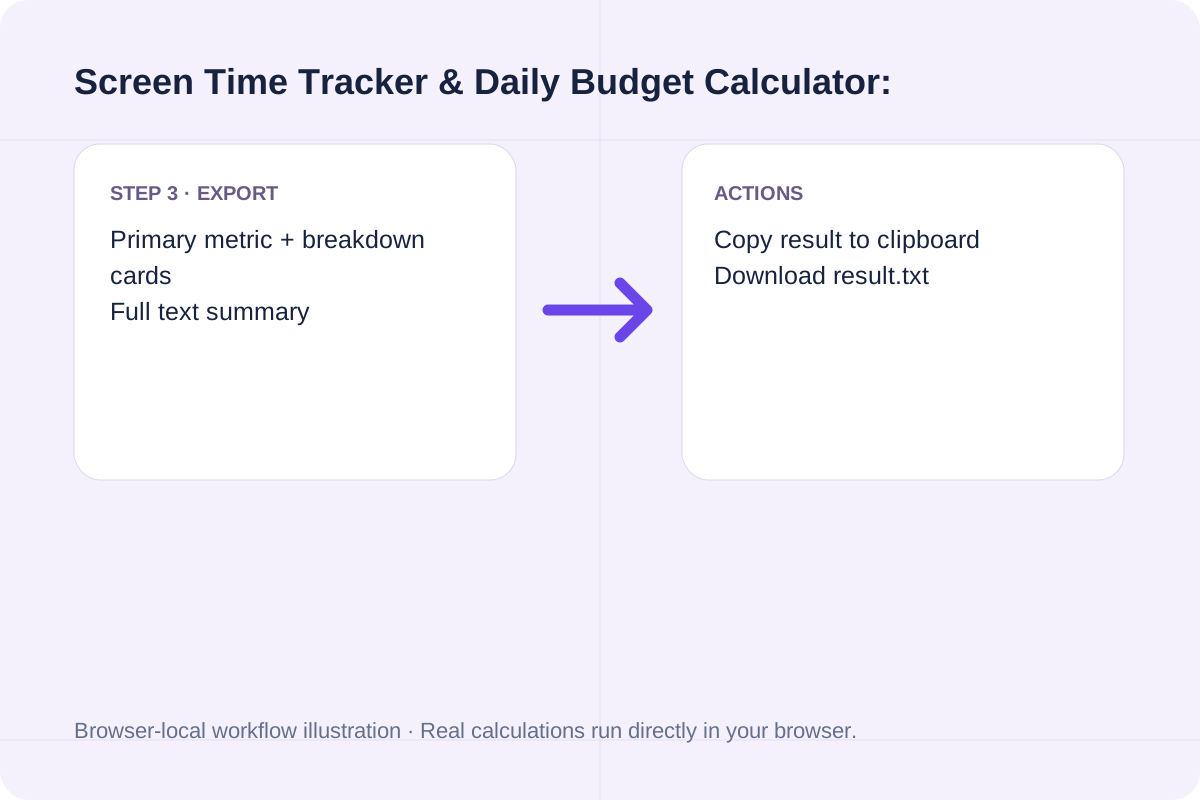
Select Analyze Screen Time, inspect the primary metric and breakdown cards, then use Copy result or Download result.txt.
Compare baseline and alternative runs for Screen Time Tracker & Daily Budget Calculator before exporting the result.
Track and analyze daily or multi-day screen time by app and category: calculate total hours, daily budget surplus/overage, productive focus share, and pickup interval.
Daily Avg = sum(Minutes) / Days; Budget Delta = DailyAvg - DailyBudget; Focus Share % = sum(ProductiveMins) / sum(TotalMins) * 100; Avg Session = TotalMins / max(1, TotalPickups).
Processes all app logs locally in your browser—separating intentional work/learning categories from passive social/entertainment scroll time and projecting annual waking-life impact.
Review the calculated output alongside your entered parameters and unit conventions.
Processes all app logs locally in your browser—separating intentional work/learning categories from passive social/entertainment scroll time and projecting annual waking-life impact.
Avoid these three common counting mistakes when logging screen time.
Daily Avg = sum(Minutes) / Days; Budget Delta = DailyAvg - DailyBudget; Focus Share % = sum(ProductiveMins) / sum(TotalMins) * 100; Avg Session = TotalMins / max(1, TotalPickups). Processes all app logs locally in your browser—separating intentional work/learning categories from passive social/entertainment scroll time and projecting annual waking-life impact.
Calculate daily new flashcards, peak review load, study minutes, and FSRS v4.5/v5 vs. Anki SM-2 intervals from total cards, exam days, and desired retention.
Open tool
Calculate remaining school days, total calendar days, weekend days, and instructional weeks between start and end dates minus holidays.
Open tool
Build an iCalendar file from a CSV event list. Use UTC timestamps or all-day dates, review each event and import the downloaded file into your calendar.
Open toolChoose another tool for your next calculation, conversion, or text task.

Compute exact calendar dates to sow seeds indoors, begin hardening off seedlings, transplant outdoors, and expect first harvest based on your last spring frost date.
Open tool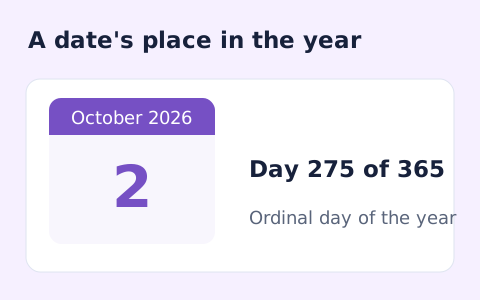
Find a date's ordinal day and days left in the year.
Open tool
Subtract two 24-hour clock times; optionally move an earlier end time into the next day.
Open tool
Find complete calendar years and months using end-of-month clamping, then count remaining UTC calendar days.
Open toolAnswers about using Screen Time Tracker & Daily Budget Calculator and understanding its results.
Multiply your average daily screen time (in hours) by 365 days. For example, 4.25 hours (255 minutes) per day equals 1,551.25 hours per year—which is 64.6 full 24-hour days, or nearly 97 waking days (assuming 16 waking hours per day).
Two days can both total 180 minutes of screen time, yet have completely different cognitive costs: 6 pickups averaging 30 minutes each indicates sustained deep work or long-form reading, whereas 90 pickups averaging 2 minutes each fragments attention every 10 minutes of the waking day.
Categories containing Work, Productivity, Education, Reading, Coding, Design, Utility, or Health are grouped into Intentional / Focus Time, while Social, Entertainment, Video, Gaming, Shopping, and News are grouped into Leisure / Distraction Time.
No. Every calculation runs 100% locally in your browser's JavaScript runtime and is never transmitted or stored externally.
Choose another tool for your next calculation, conversion, or text task.