

Commission Calculator
Calculate flat or 2-tier accelerated sales commission, effective commission rate, total base + variable payout, and net revenue.
Open toolEnter your team headcount, working days, daily hours, PTO deductions, focus factor, and planned workload in the Capacity Planning Calculator below to measure productive capacity, utilization percentage, and FTE gap.
Enter the inputs, then select Calculate Team Capacity.
Result will appear here
The Capacity Planning Calculator computes gross payroll hours, deducts team-wide PTO and holiday hours to find net attendance, applies your productive focus factor percentage, and compares the resulting capacity against your planned demand.
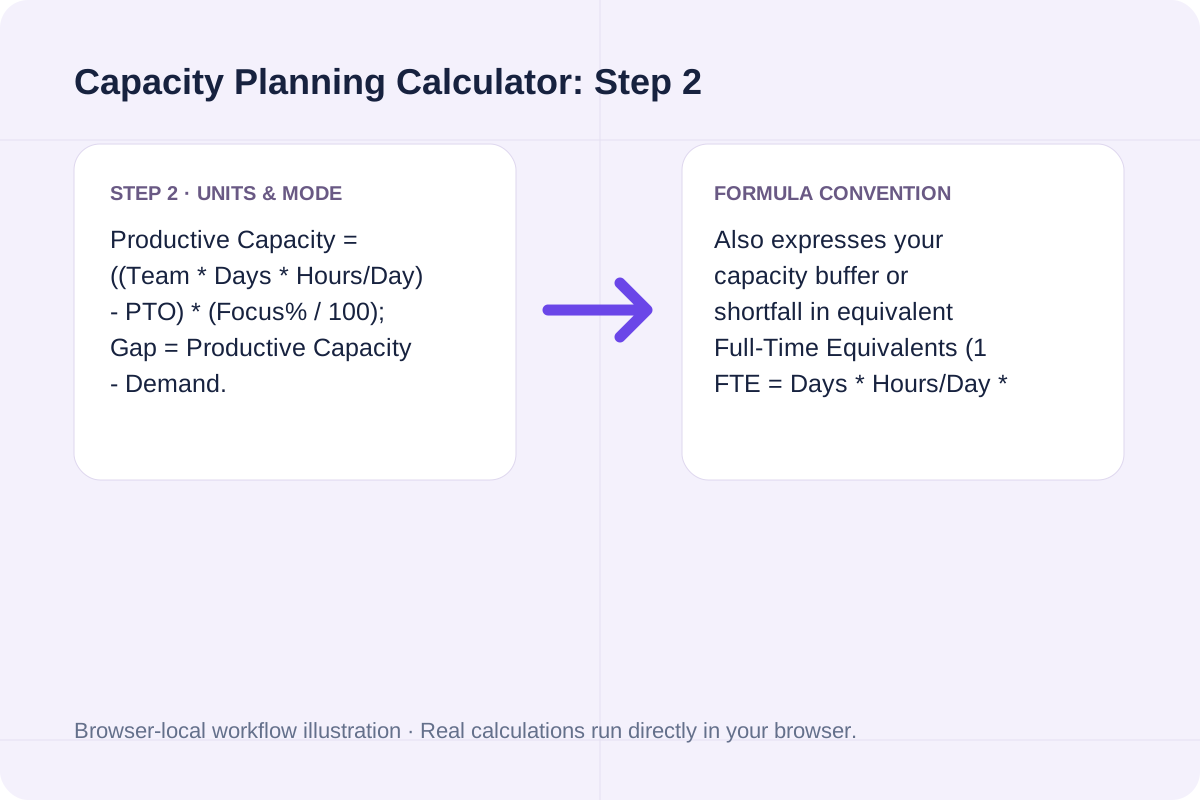
Productive Capacity = ((Team * Days * Hours/Day) - PTO) * (Focus% / 100); Gap = Productive Capacity - Demand.
Also expresses your capacity buffer or shortfall in equivalent Full-Time Equivalents (1 FTE = Days * Hours/Day * Focus%).
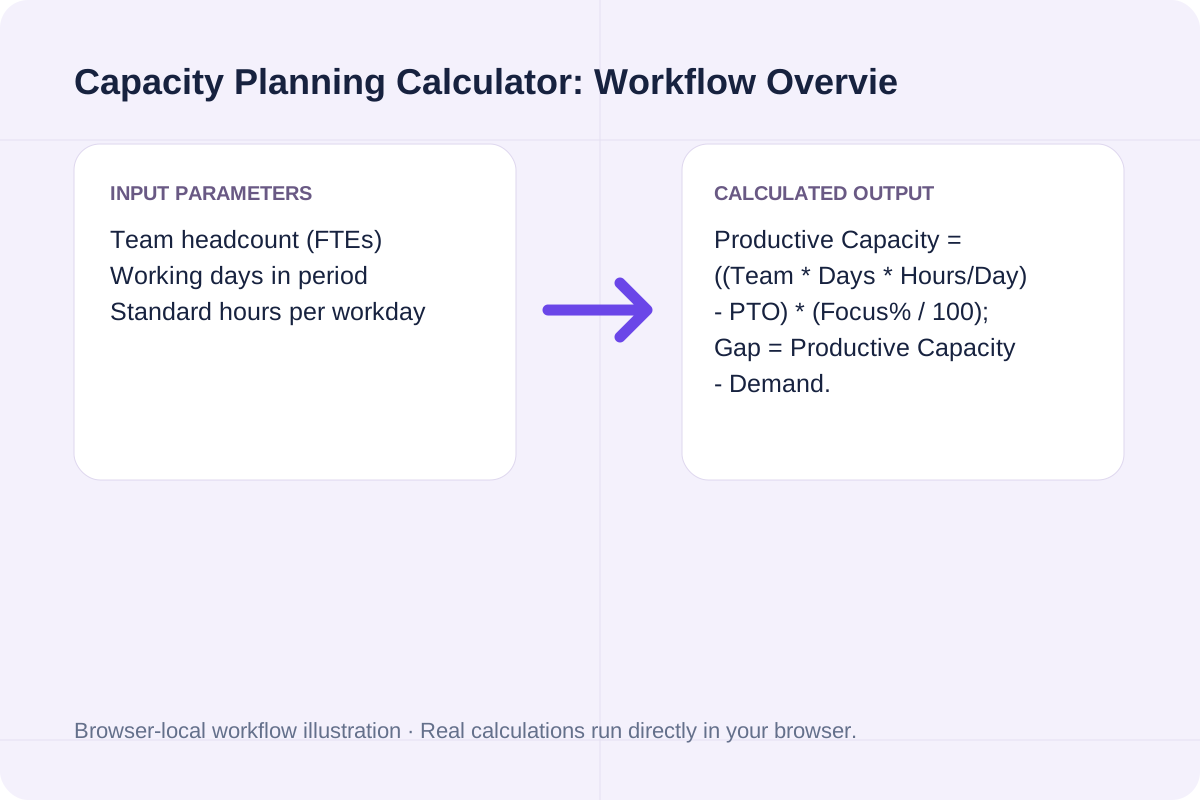
Review the input parameters, allowed value ranges, and worked reference cases for the Capacity Planning Calculator below before running your calculation.
| Parameter / Scenario | Default / Sample Value | Rule or Allowed Range | Output / Usage Note |
|---|---|---|---|
| Input: Team headcount (FTEs) | 8 | Range: 1 to 10000 | Required workspace parameter |
| Input: Working days in period | 10 | Range: 1 to 365 | Required workspace parameter |
| Input: Standard hours per workday | 8 | Range: 0.5 to 24 | Required workspace parameter |
| Input: Total team PTO, holidays & leave | 24 | Range: 0 to 100000 | Required workspace parameter |
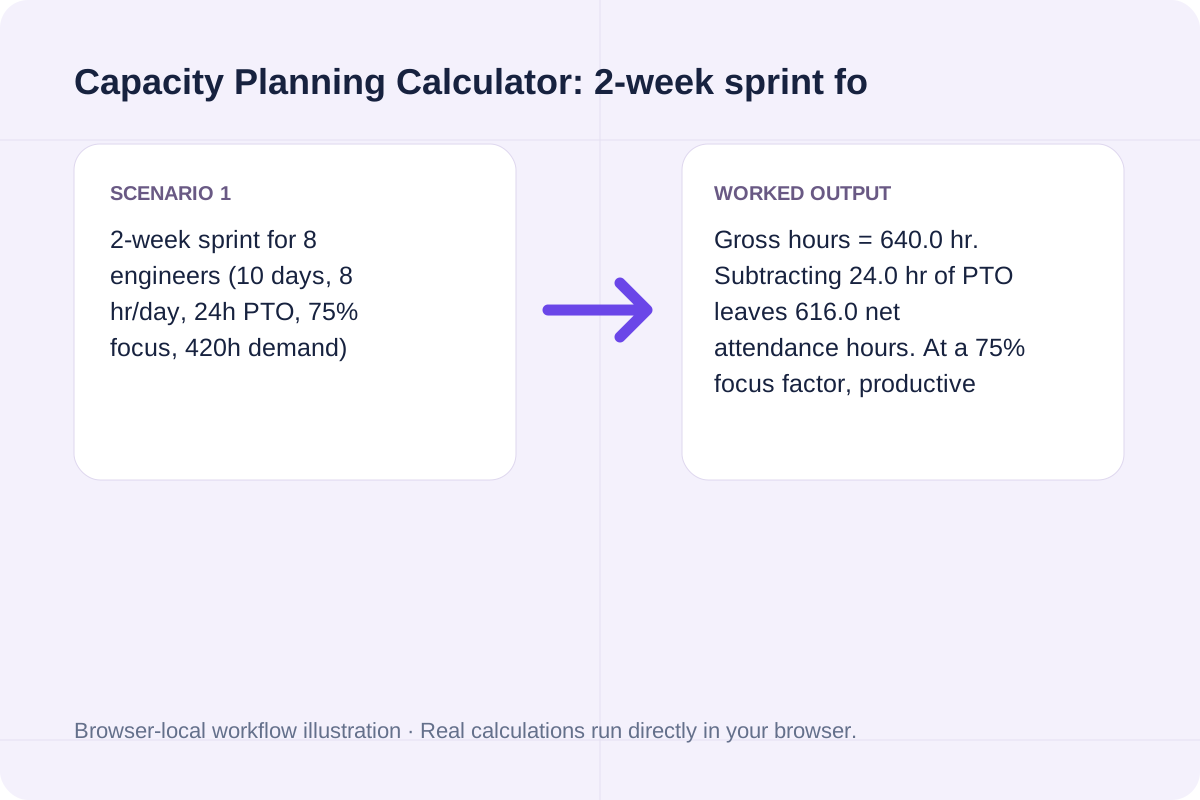
| Worked Case 1: 2-week sprint for 8 engineers (10 days, 8 hr/day, 24h PTO, 75% focus, 420h demand) | Preloaded / test values | Gross Hours = Team * Days * HoursPerDay; Net Attendance = Gross - PTO; Productive Capacity = Net Attendance * (FocusFactor% / 100); Utilization = Demand / Productive Capacity | Gross hours = 640.0 hr. Subtracting 24.0 hr of PTO leaves 616.0 net attendance hours. At a 75% focus factor, productive capacity is 462.0 hr (57.75 hr/person). Against 420.0 hr of demand, utilization is 90.91% with a +42.0 hr (+0.73 FTE) buffer. |
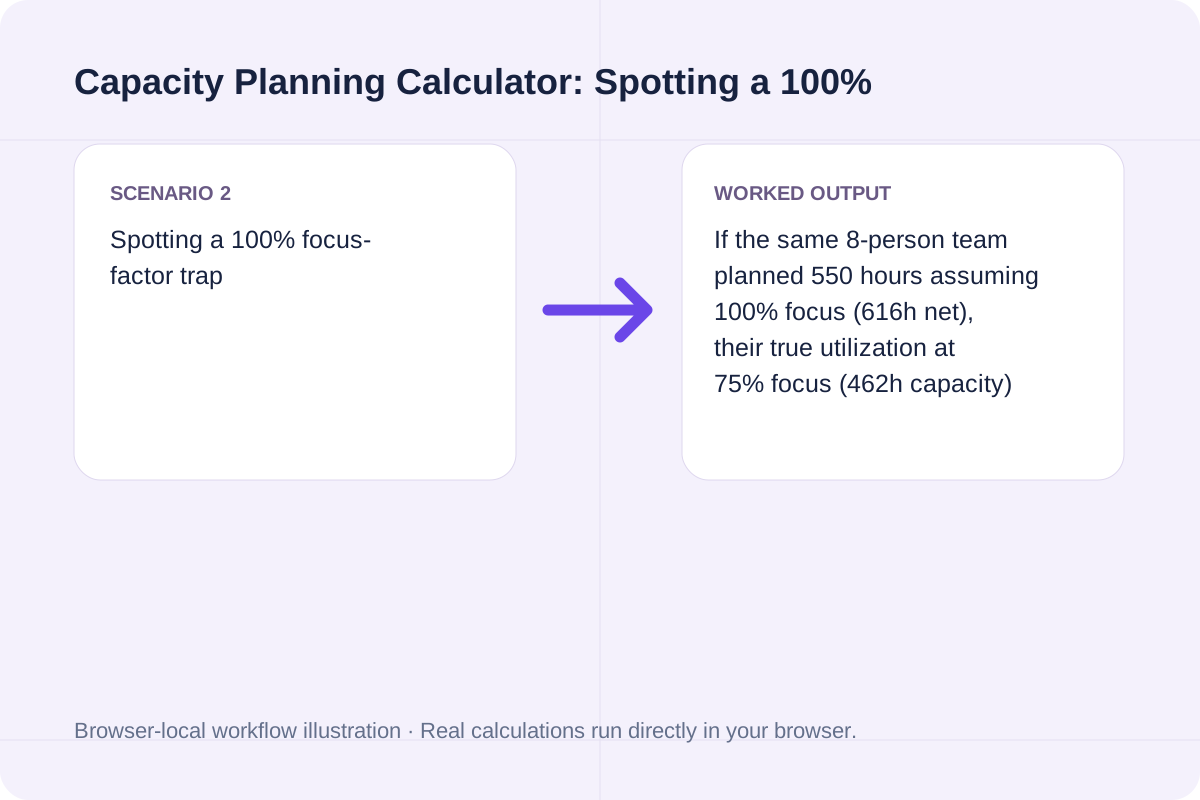
| Worked Case 2: Spotting a 100% focus-factor trap | Preloaded / test values | Gross Hours = Team * Days * HoursPerDay; Net Attendance = Gross - PTO; Productive Capacity = Net Attendance * (FocusFactor% / 100); Utilization = Demand / Productive Capacity | If the same 8-person team planned 550 hours assuming 100% focus (616h net), their true utilization at 75% focus (462h capacity) would be 119.05% (-88.0 hr / -1.52 FTE deficit). |
Gather your team's upcoming PTO schedule and backlog hour estimates before sprint or quarterly planning.
Input the number of people on the team, working days in the cycle (e.g., 10 days for a 2-week sprint), and standard hours per day.
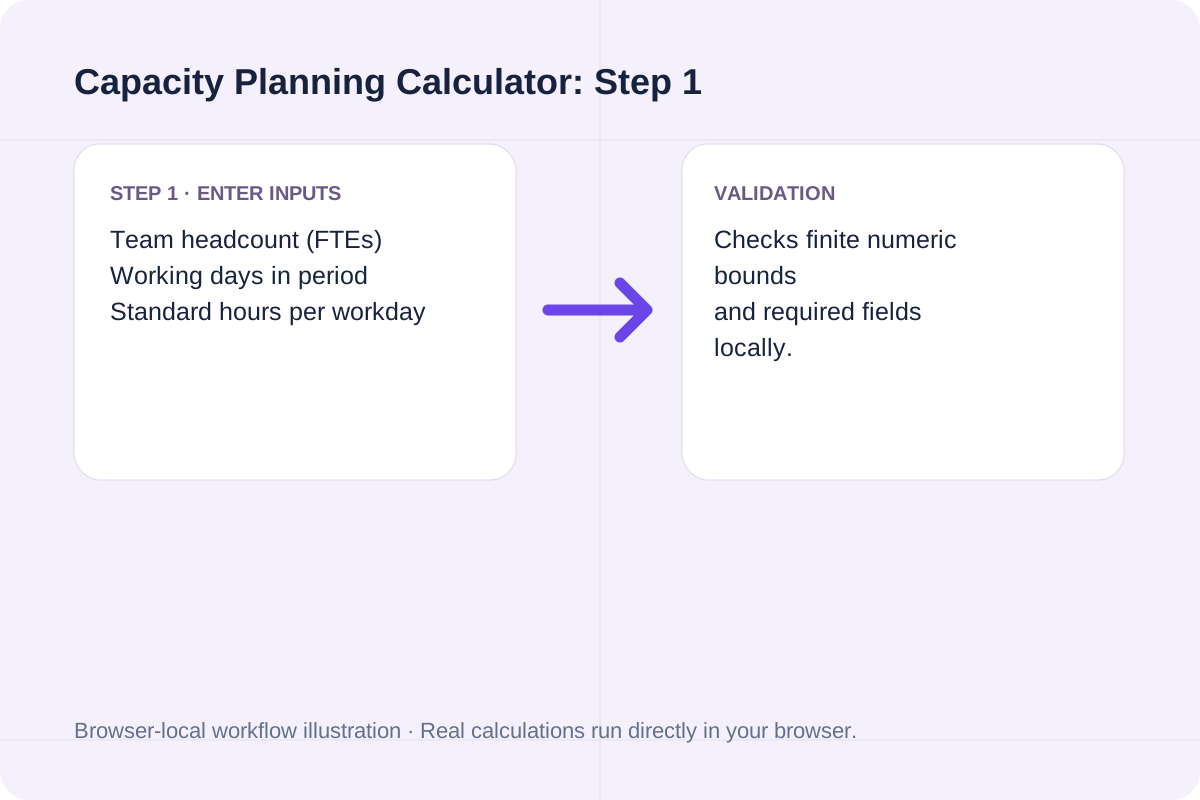
Enter combined vacation/holiday hours for the period and set a realistic focus factor (e.g., 75%).
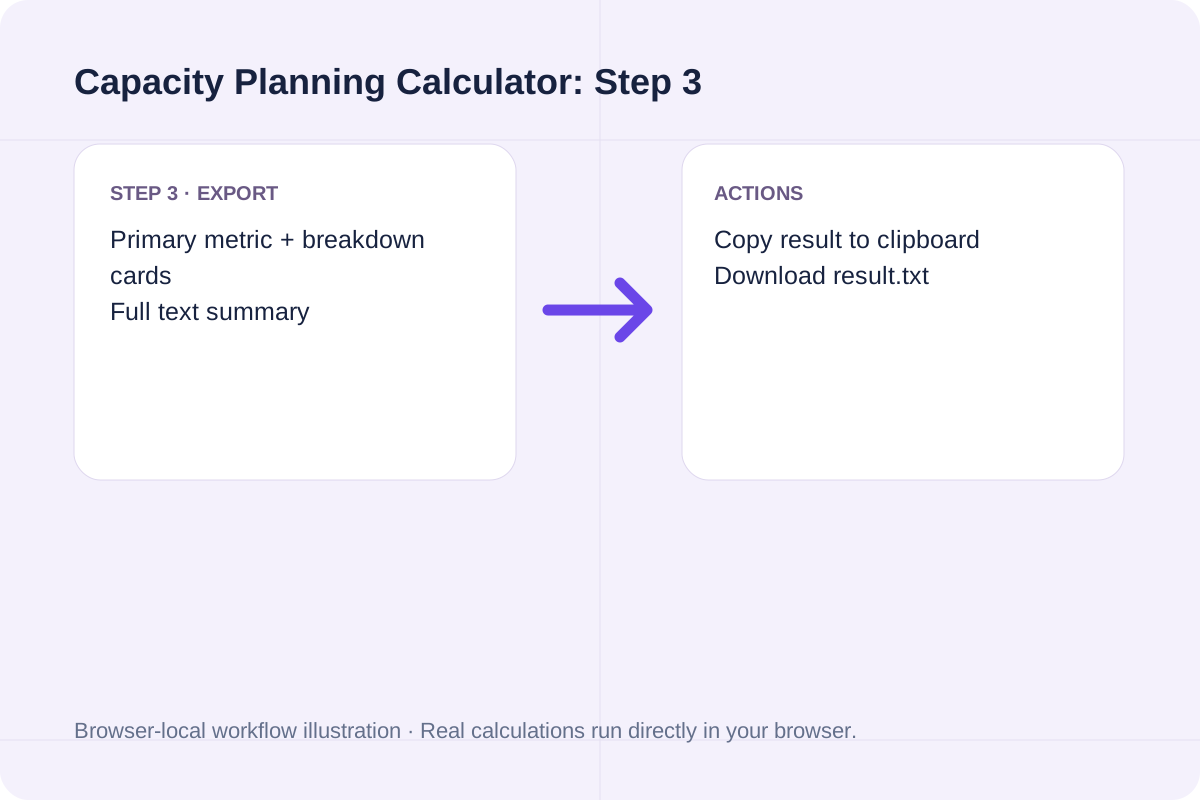
Input your planned project demand in hours and click Calculate Team Capacity to see utilization rate and FTE buffer or deficit.
Compare a balanced 2-week sprint against an over-committed quarterly roadmap.
Gross hours = 640.0 hr. Subtracting 24.0 hr of PTO leaves 616.0 net attendance hours. At a 75% focus factor, productive capacity is 462.0 hr (57.75 hr/person). Against 420.0 hr of demand, utilization is 90.91% with a +42.0 hr (+0.73 FTE) buffer.
If the same 8-person team planned 550 hours assuming 100% focus (616h net), their true utilization at 75% focus (462h capacity) would be 119.05% (-88.0 hr / -1.52 FTE deficit).
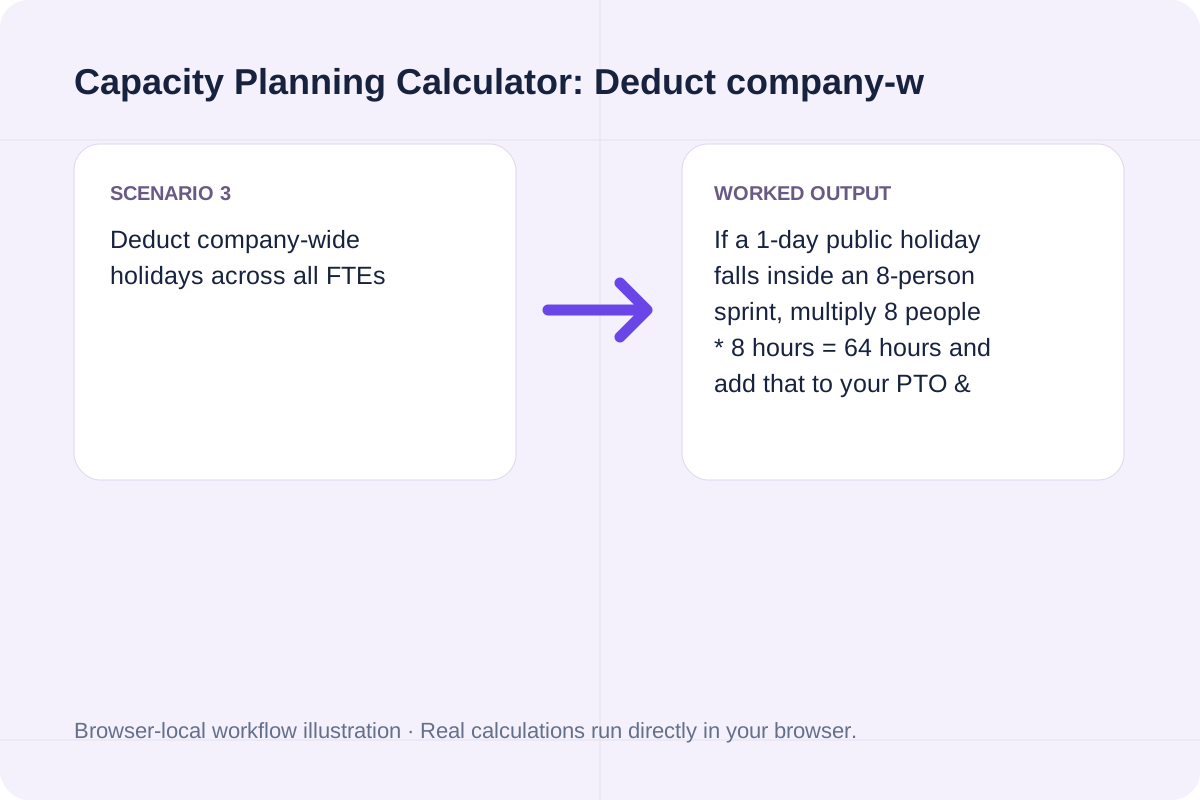
If a 1-day public holiday falls inside an 8-person sprint, multiply 8 people * 8 hours = 64 hours and add that to your PTO & holiday box.
Aim for 80% to 90% utilization of productive capacity so unplanned bugs do not derail delivery.
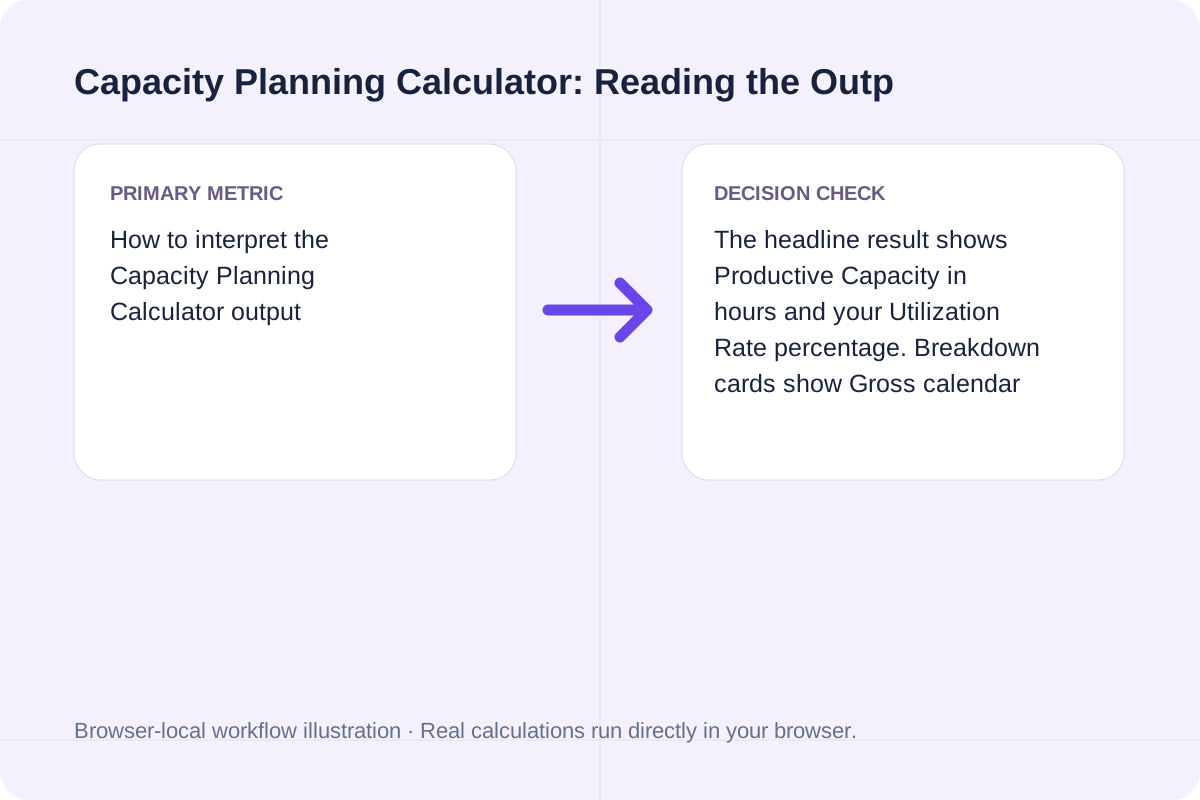
The headline result shows Productive Capacity in hours and your Utilization Rate percentage. Breakdown cards show Gross calendar hours, Net attendance hours after PTO, Capacity surplus or deficit (in hours and FTEs), and Productive hours per team member.
Remember that hours are not interchangeable across specialized roles.
PTO hours must be strictly less than gross team hours so net attendance stays positive. Aggregate hour math assumes tasks can be distributed across team members; if frontend, backend, or QA skills are bottlenecked, run a separate capacity check for each role.
Calculate flat or 2-tier accelerated sales commission, effective commission rate, total base + variable payout, and net revenue.
Open tool
Calculate Customer Lifetime Value (CLV), gross lifetime revenue, LTV:CAC ratio, and CAC payback months from AOV, frequency, margin, and lifespan.
Open tool
Calculate total planned gift spending across recipient tiers, wrapping, and shipping, and compare it against your overall gift budget.
Open toolChoose another tool for your next calculation, conversion, or text task.

Calculate baker percentages and rescale all ingredients to a target flour mass.
Open tool
Calculate standard deviation as a percentage of a positive mean.
Open tool
Calculate GC percentage for DNA or RNA while separately counting unambiguous bases and IUPAC ambiguity symbols.
Open tool
Calculate ingredient-cost percentage and target-percentage selling price.
Open toolAnswers about using Capacity Planning Calculator and understanding its results.
Gross capacity is the raw calendar total (Headcount * Working Days * Hours/Day). Productive capacity subtracts PTO and holidays first, then multiplies by your Focus Factor (typically 70% to 80%) to account for meetings, Slack/email, and administrative overhead.
Scrum and operations benchmarks typically use 70% to 80% (5.6 to 6.4 productive project hours per 8-hour day) for individual contributors, and 50% to 65% for tech leads or staff who handle on-call triage and ceremonies.
A utilization rate above 100% means your planned task demand exceeds your team's productive capacity. The calculator displays the exact hour deficit and the equivalent FTE headcount gap so you can de-scope work or add resources.
Enter combined PTO and holiday hours for the entire team in 'Total team PTO, holidays & leave'. For example, if 3 people each take 1 day (8 hours) off during the sprint, enter 24 hours.
Choose another tool for your next calculation, conversion, or text task.