
Normal Distribution CDF Calculator
Estimate the normal probability P(X ≤ x).
Open toolEvaluate the normal probability density at x. Standard deviation must be positive.
Enter the inputs, then select Calculate.
Result will appear here
Evaluate the normal probability density at x.
Standard deviation must be positive. A probability density is not the probability of one exact continuous value. Finite real inputs; output uses up to 12 significant digits. Floating-point results may be rounded.
Follow the labelled inputs.
Replace the example with value x. The field labels specify the expected format and units.
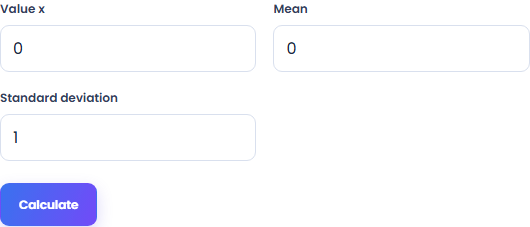
Set mean, standard deviation. Standard deviation must be positive.
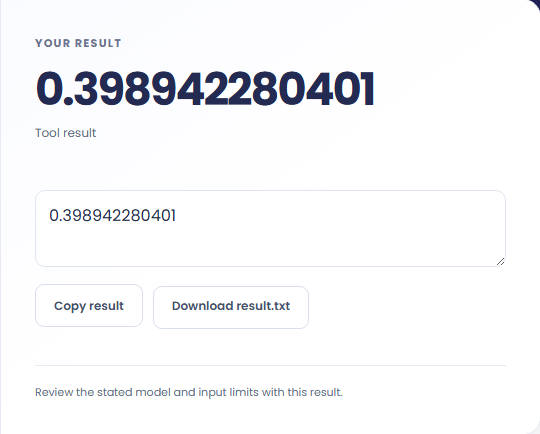
Select Calculate. Review the calculated result, then copy it or download the result text.
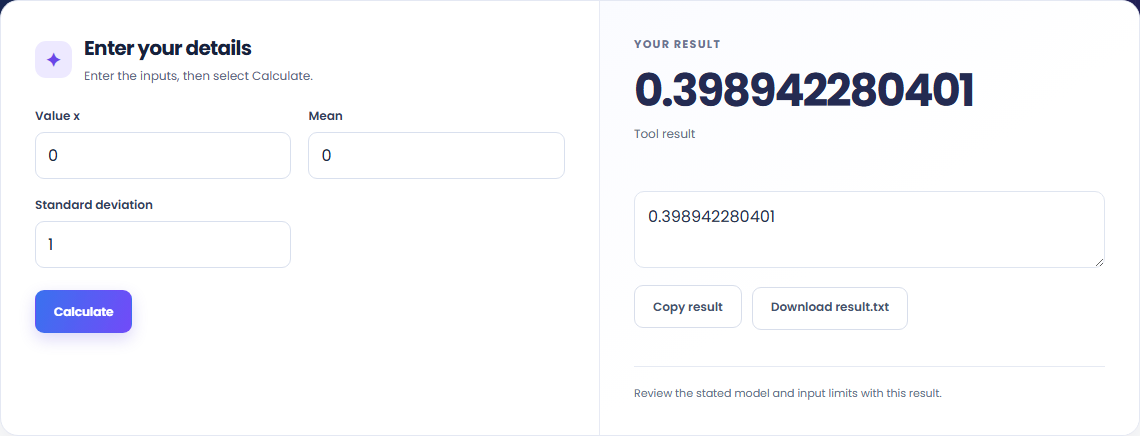
The starting example produces 0.398942280401. Evaluate the normal probability density at x.

Read the labels for value x and mean, standard deviation. Standard deviation must be positive.

Copy the calculated result into your notes. Keep the formula and assumptions with it if someone else needs to reproduce the calculation.

Read the units and assumptions with the output.
Evaluate the normal probability density at x.
Standard deviation must be positive. A probability density is not the probability of one exact continuous value. Finite real inputs; output uses up to 12 significant digits. Floating-point results may be rounded.

Check the stated scope before you run it.
Standard deviation must be positive. A probability density is not the probability of one exact continuous value. Finite real inputs; output uses up to 12 significant digits. Floating-point results may be rounded.
The input stays in this browser. Copy result and Download save the same displayed text.

Estimate the normal probability P(X ≤ x).
Open tool
Calculate the probability of exactly k binomial successes.
Open tool
A PDF with revised visible page boundaries. Inset each current CropBox by the entered margins in PDF points.
Open toolChoose another tool for your next calculation, conversion, or text task.
An image-only PDF of extracted EPUB chapter text. Extract EPUB text in spine order, wrap it on canvas pages and embed those page images in a PDF.
Open tool
A PDF with flattened form fields or rasterized pages. Use pdf-lib form flattening or render all page appearances into an image-only PDF.
Open tool
A one-page PDF of the primary HEIC image. Decode HEIC pixels with the local libheif WebAssembly decoder and embed a PNG in a PDF.
Open tool
A PDF containing selected pages in your order. Parse 1-based page numbers and ranges, then copy the selected pages into a new PDF.
Open toolAnswers about using Normal Distribution PDF Calculator and understanding its results.
Standard deviation must be positive. A probability density is not the probability of one exact continuous value. Finite real inputs; output uses up to 12 significant digits. Floating-point results may be rounded.
Use Copy result to copy the displayed text, or Download to save it as a text file. The tool runs in your browser and does not require an account.
Check the calculated result, then copy or download it.