

Irrigation Runtime Calculator
Estimate irrigation runtime from target depth and measured application rate.
Open toolCompute low-quarter distribution uniformity and show the sorted catch-can depth distribution. Provide Equal-area catch-can depths (mm) to compute results directly in your browser. DU_LQ (%) = 100 × mean of lowest n/4 readings / overall mean. Use depths measured over the same time with equal-area collectors, or values already converted to equivalent depth. Mean must be positive; precipitation rate and CU are not inferred. Numeric output uses up to 12 significant digits; floating-point rounding can occur.
Enter the inputs, then select Calculate.
Result will appear here
The Irrigation Distribution Uniformity Calculator evaluates Equal-area catch-can depths (mm) in client-side JavaScript using the deterministic rule below and updates the output panel immediately without uploading data to a server.
Compute low-quarter distribution uniformity and show the sorted catch-can depth distribution.
DU_LQ (%) = 100 × mean of lowest n/4 readings / overall mean. Use depths measured over the same time with equal-area collectors, or values already converted to equivalent depth. Mean must be positive; precipitation rate and CU are not inferred. Numeric output uses up to 12 significant digits; floating-point rounding can occur.
Review the input parameters, allowed value ranges, and worked reference cases for the Irrigation Distribution Uniformity Calculator below before running your calculation.
| Parameter / Scenario | Default / Sample Value | Rule or Allowed Range | Output / Usage Note |
|---|---|---|---|
| Input: Equal-area catch-can depths (mm) | 8,9,10,11 | Use at least four nonnegative depths; reading count must be a multiple of four, at most 1,000. | Required workspace parameter |
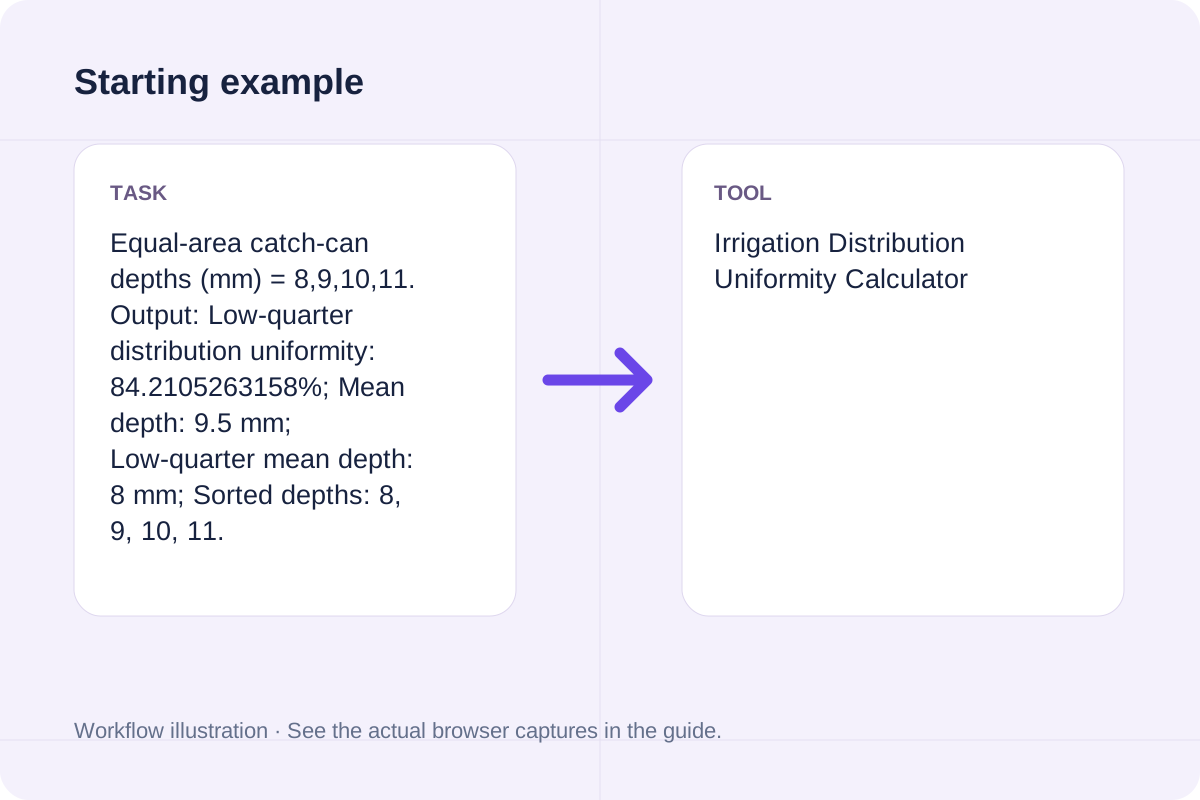
| Worked Case 1: Baseline run (Equal-area catch-can depths (mm) = 8,9,10,) | Preloaded / test values | Compute low-quarter distribution uniformity and show the sorted catch-can depth distribution | Equal-area catch-can depths (mm) = 8,9,10,11. Output: Low-quarter distribution uniformity: 84.2105263158%; Mean depth: 9.5 mm; Low-quarter mean depth: 8 mm; Sorted depths: 8, 9, 10, 11. |
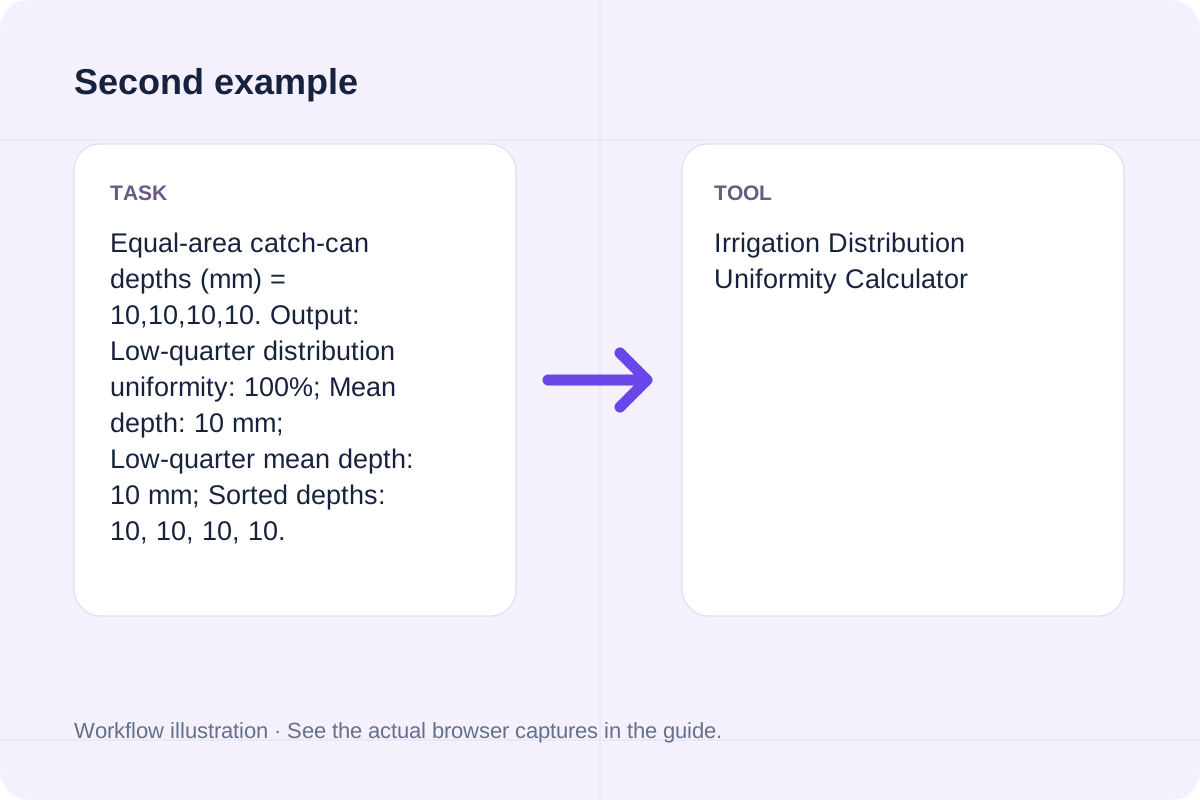
| Worked Case 2: Comparison scenario (Sprinkler Catch Can Calculator) | Preloaded / test values | Compute low-quarter distribution uniformity and show the sorted catch-can depth distribution | Equal-area catch-can depths (mm) = 10,10,10,10. Output: Low-quarter distribution uniformity: 100%; Mean depth: 10 mm; Low-quarter mean depth: 10 mm; Sorted depths: 10, 10, 10, 10. |
Follow these three steps to configure Equal-area catch-can depths (mm), verify unit and boundary rules, and export your Irrigation Distribution Uniformity Calculator output.
Start with equal-area catch-can depths (mm). Use at least four nonnegative depths; reading count must be a multiple of four, at most 1,000.
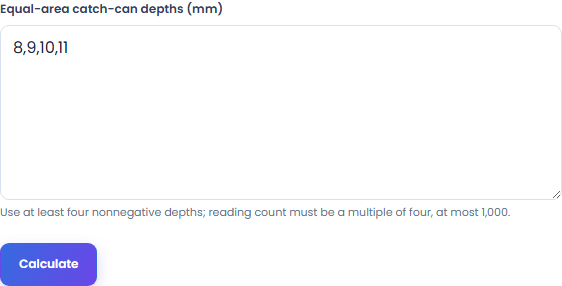
DU_LQ (%) = 100 × mean of lowest n/4 readings / overall mean. Use depths measured over the same time with equal-area collectors, or values already converted to equivalent depth. Mean must be positive; precipitation rate and CU are not inferred. Numeric output uses up to 12 significant digits; floating-point rounding can occur.
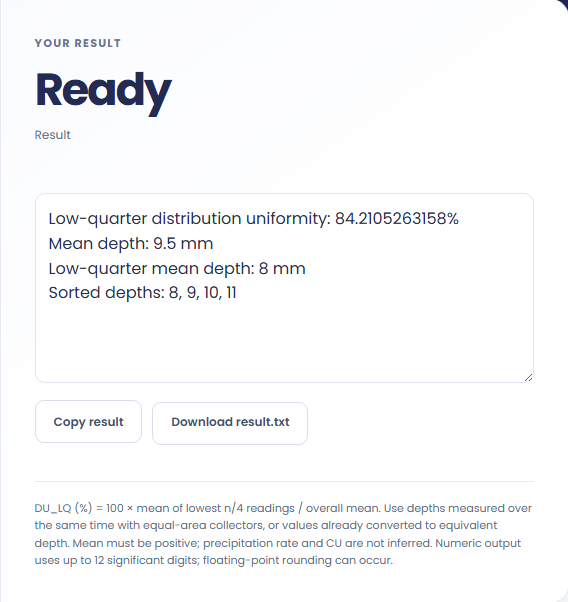
Select Calculate, check the labelled result, then use Copy result or Download result.txt.
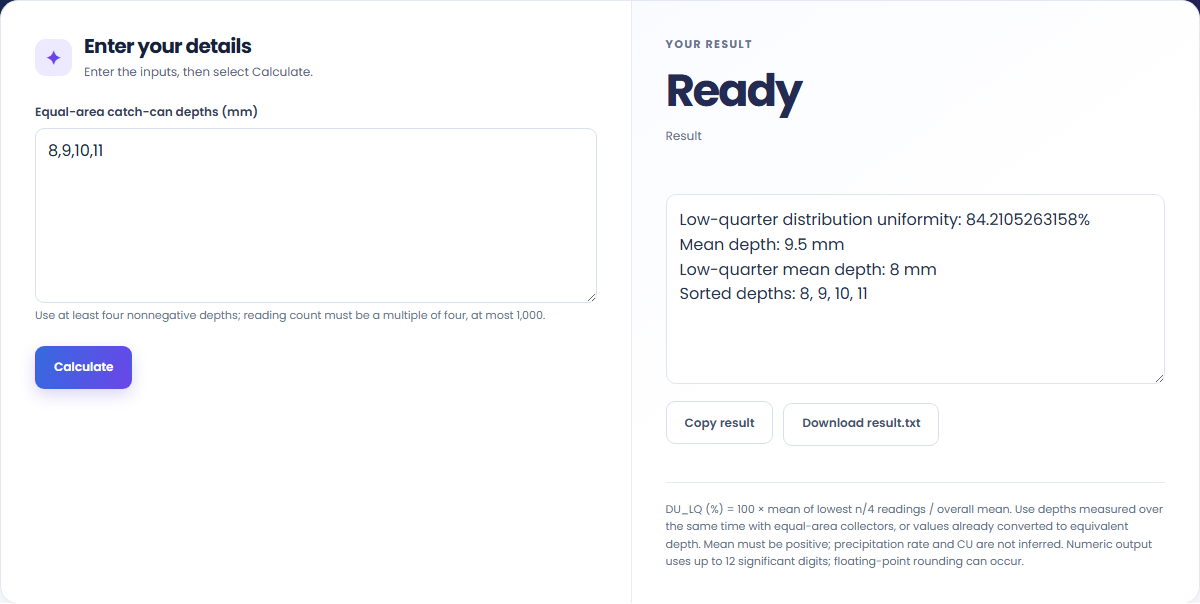
These concrete scenarios illustrate how the Irrigation Distribution Uniformity Calculator processes baseline inputs, comparison checks, and boundary constraints.
Equal-area catch-can depths (mm) = 8,9,10,11. Output: Low-quarter distribution uniformity: 84.2105263158%; Mean depth: 9.5 mm; Low-quarter mean depth: 8 mm; Sorted depths: 8, 9, 10, 11.
Equal-area catch-can depths (mm) = 10,10,10,10. Output: Low-quarter distribution uniformity: 100%; Mean depth: 10 mm; Low-quarter mean depth: 10 mm; Sorted depths: 10, 10, 10, 10.
When solving for 'irrigation distribution uniformity calculator', verify that Equal-area catch-can depths (mm) use consistent units and stay within the documented scope: DU_LQ (%) = 100 × mean of lowest n/4 readings / overall mean. Use depths measured over the same time with equal-area collectors, or values already converted to equivalent depth. Mean must be positive; precipitation rate and CU are not inferred. Numeric output uses up to 12 significant digits; floating-point rounding can occur.
The output panel reports the exact result derived from Equal-area catch-can depths (mm) alongside any unit or formatting notes.
Every calculation follows the rule: Compute low-quarter distribution uniformity and show the sorted catch-can depth distribution. Because JavaScript uses IEEE 754 double-precision floating-point arithmetic, numeric outputs display up to 12 significant digits where applicable.
Always cross-check the displayed result against the scope note (DU_LQ (%) = 100 × mean of lowest n/4 readings / overall mean. Use depths measured over the same time with equal-area collectors, or values already converted to equivalent depth. Mean must be positive; precipitation rate and CU are not inferred. Numeric output uses up to 12 significant digits; floating-point rounding can occur) before applying the value to production specifications, financial models, or lab records.
Review these boundary constraints and validation rules before relying on the Irrigation Distribution Uniformity Calculator output.
Operational scope: DU_LQ (%) = 100 × mean of lowest n/4 readings / overall mean. Use depths measured over the same time with equal-area collectors, or values already converted to equivalent depth. Mean must be positive; precipitation rate and CU are not inferred. Numeric output uses up to 12 significant digits; floating-point rounding can occur. Inputs that violate minimum/maximum bounds or required format rules are rejected with a clear diagnostic prompt.
Need an adjacent calculation in Everyday Math? Use the related tools linked below to chain your workflow without leaving your browser.
Estimate irrigation runtime from target depth and measured application rate.
Open tool
Fold a supplied signal frequency into the first Nyquist band and show the folding curve.
Open tool
Find arrow front-of-center percentage and show the balance point relative to the midpoint.
Open toolChoose another tool for your next calculation, conversion, or text task.

Find two-isotope abundance percentages from distinct isotope masses and a supplied mean.
Open tool
Calculate waist radius, outer hem radius, hem sweep, and fabric yardage for full, 3/4, half, or quarter circle skirts with seam allowance.
Open tool
Compute the spatial output shape for one- to three-dimensional convolution parameters.
Open tool
Compute the effective density, total mass, total volume, and mass/volume percentages of a two-part mixture from masses and densities or volumes and densities.
Open toolAnswers about using Irrigation Distribution Uniformity Calculator and understanding its results.
The Irrigation Distribution Uniformity Calculator applies the rule: Compute low-quarter distribution uniformity and show the sorted catch-can depth distribution. Enter Equal-area catch-can depths (mm) into the workspace and the tool computes the exact output in your browser.
Yes. Provide Equal-area catch-can depths (mm) using the documented units and format shown in the quick reference table above. Preloaded default values let you test the workflow immediately.
DU_LQ (%) = 100 × mean of lowest n/4 readings / overall mean. Use depths measured over the same time with equal-area collectors, or values already converted to equivalent depth. Mean must be positive; precipitation rate and CU are not inferred. Numeric output uses up to 12 significant digits; floating-point rounding can occur. Confirm that your inputs fall within the allowed ranges before exporting the result.
Yes. All calculations for the Irrigation Distribution Uniformity Calculator execute 100% locally in your browser's JavaScript runtime. No inputs or results are uploaded to any external server.
Choose another tool for your next calculation, conversion, or text task.