

Conversion Rate Calculator
Find conversion rate from unique eligible participants and goal-completing participants.
Open toolFind survey response rate from eligible invitations and complete responses. Provide Eligible survey invitations, Complete responses from invitees to compute results directly in your browser. Responses are a subset of eligible invitees for one survey; cannot exceed invitations. Does not estimate nonresponse bias or sample representativeness. Inputs and results use floating-point numbers; output shows up to 12 significant digits. Rounding can occur. Common search workflows supported include "response rate calculator", "survey response rate calculator", "calculate survey response rate".
Enter the inputs, then select Calculate.
Result will appear here
The Survey Response Rate Calculator evaluates Eligible survey invitations, Complete responses from invitees in client-side JavaScript using the deterministic rule below and updates the output panel immediately without uploading data to a server.
Find survey response rate from eligible invitations and complete responses.
Responses are a subset of eligible invitees for one survey; cannot exceed invitations. Does not estimate nonresponse bias or sample representativeness. Inputs and results use floating-point numbers; output shows up to 12 significant digits. Rounding can occur.
Review the input parameters, allowed value ranges, and worked reference cases for the Survey Response Rate Calculator below before running your calculation.
| Parameter / Scenario | Default / Sample Value | Rule or Allowed Range | Output / Usage Note |
|---|---|---|---|
| Input: Eligible survey invitations | 100 | Range: 1 to 1000000 | Required workspace parameter |
| Input: Complete responses from invitees | 40 | Range: 0 to 1000000 | Required workspace parameter |
| Worked Case 1: Baseline run (Eligible survey invitations = 100) | Preloaded / test values | Find survey response rate from eligible invitations and complete responses | Eligible survey invitations = 100; Complete responses from invitees = 40. The displayed output is 40%. |
| Worked Case 2: Comparison scenario (statistically valid survey response rate c) | Preloaded / test values | Find survey response rate from eligible invitations and complete responses | Eligible survey invitations = 80; Complete responses from invitees = 12. The displayed output is 15%. |
Follow these three steps to configure Eligible survey invitations, Complete responses from invitees, verify unit and boundary rules, and export your Survey Response Rate Calculator output.
Enter eligible survey invitations. Allowed range: 1 to 1000000. Whole numbers only.
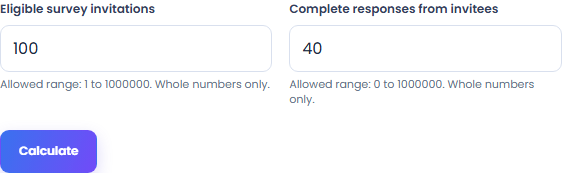
Set complete responses from invitees. Count complete responses from the same eligible invitations used as the denominator.
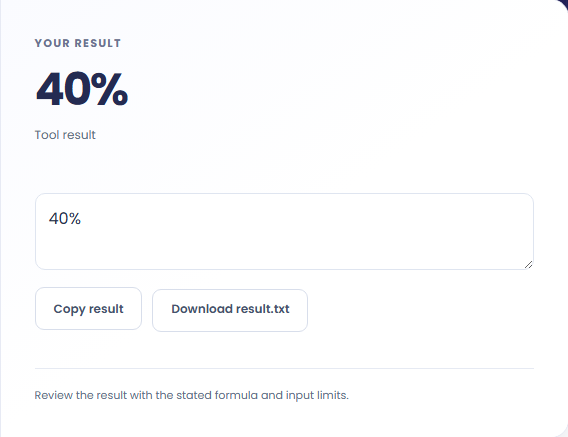
Select Calculate to see the percentage of invitees who completed the survey. Copy result copies this text; Download saves it as a TXT file.
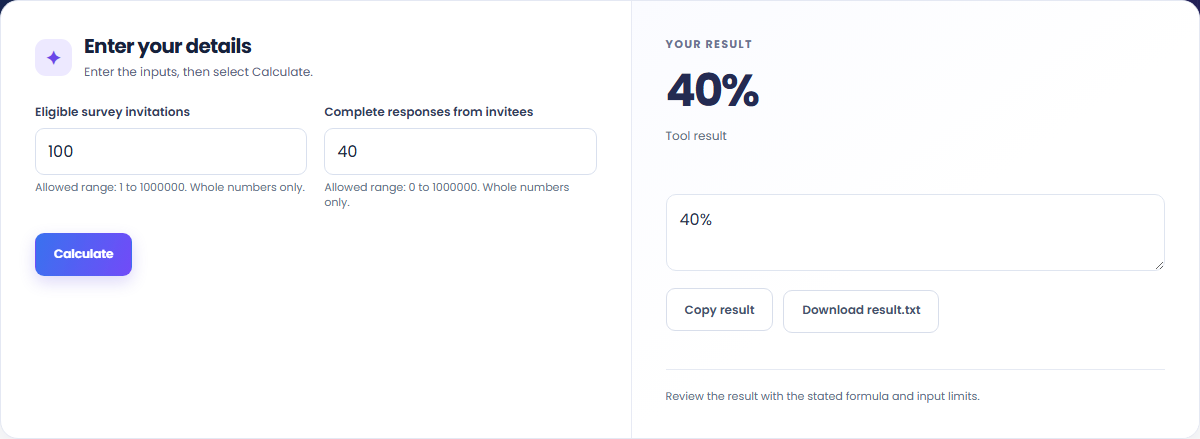
These concrete scenarios illustrate how the Survey Response Rate Calculator processes baseline inputs, comparison checks, and boundary constraints.
Eligible survey invitations = 100; Complete responses from invitees = 40. The displayed output is 40%.

Eligible survey invitations = 80; Complete responses from invitees = 12. The displayed output is 15%.

When solving for 'response rate calculator', verify that Eligible survey invitations, Complete responses from invitees use consistent units and stay within the documented scope: Responses are a subset of eligible invitees for one survey; cannot exceed invitations. Does not estimate nonresponse bias or sample representativeness. Inputs and results use floating-point numbers; output shows up to 12 significant digits. Rounding can occur.

The output panel reports the exact result derived from Eligible survey invitations, Complete responses from invitees alongside any unit or formatting notes.
The result is the percentage of invitees who completed the survey. Report the response rate for a defined survey invitation group.
Responses cannot exceed invitations; the result does not measure nonresponse bias or representativeness.
Numerical output shows up to 12 significant digits. Floating-point arithmetic and display rounding can affect the last digits.

Review these boundary constraints and validation rules before relying on the Survey Response Rate Calculator output.
Operational scope: Responses are a subset of eligible invitees for one survey; cannot exceed invitations. Does not estimate nonresponse bias or sample representativeness. Inputs and results use floating-point numbers; output shows up to 12 significant digits. Rounding can occur. Inputs that violate minimum/maximum bounds or required format rules are rejected with a clear diagnostic prompt.
Need an adjacent calculation in Everyday Math? Use the related tools linked below to chain your workflow without leaving your browser.

Find conversion rate from unique eligible participants and goal-completing participants.
Open tool
Analyze 5-point Likert survey responses to find the weighted mean, median, mode, sample standard deviation, and top-2-box agreement share.
Open tool
Find a bounce-event percentage under a selected user-supplied count definition.
Open toolChoose another tool for your next calculation, conversion, or text task.

Find swimming pace per 100 m and average length time.
Open tool
Find an ideal synodic period from two constant sidereal periods and relative direction.
Open tool
Find customer churn as customers lost from the starting cohort divided by that cohort.
Open tool
Find recorded email click-to-open rate as unique clicks divided by unique opens.
Open toolAnswers about using Survey Response Rate Calculator and understanding its results.
The Survey Response Rate Calculator applies the rule: Find survey response rate from eligible invitations and complete responses. Enter Eligible survey invitations, Complete responses from invitees into the workspace and the tool computes the exact output in your browser.
Yes. Provide Eligible survey invitations, Complete responses from invitees using the documented units and format shown in the quick reference table above. Preloaded default values let you test the workflow immediately.
Responses are a subset of eligible invitees for one survey; cannot exceed invitations. Does not estimate nonresponse bias or sample representativeness. Inputs and results use floating-point numbers; output shows up to 12 significant digits. Rounding can occur. Confirm that your inputs fall within the allowed ranges before exporting the result.
Yes. All calculations for the Survey Response Rate Calculator execute 100% locally in your browser's JavaScript runtime. No inputs or results are uploaded to any external server.
Choose another tool for your next calculation, conversion, or text task.