

Margin Of Error Calculator
Find a mean margin of error as critical value × population standard deviation / sqrt(n).
Open toolEnter the response counts for ratings 1 through 5 in the Likert Scale Calculator below to compute the weighted mean, median, mode, sample standard deviation, Top-2-Box agreement, and net agreement score.
Enter the inputs, then select Calculate Likert stats.
Result will appear here
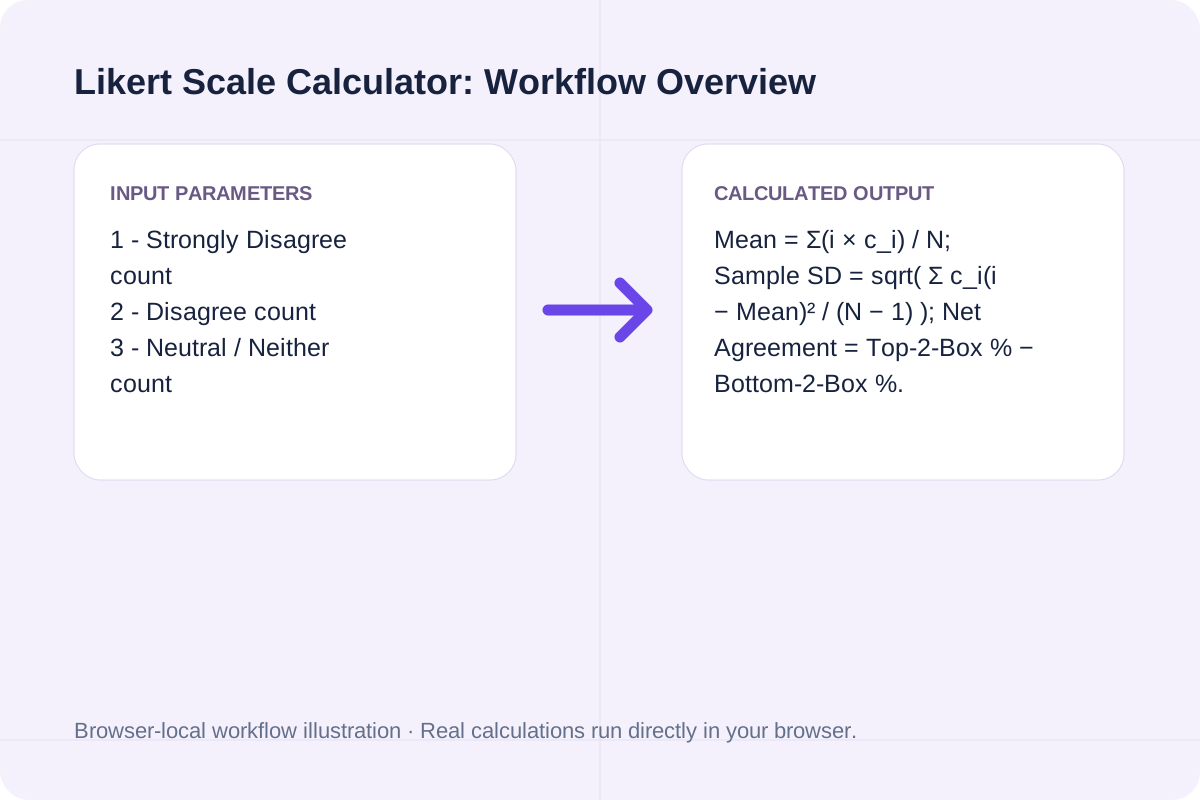
The Likert Scale Calculator aggregates frequency counts across a standard 1-to-5 rating scale to produce both parametric summary metrics (mean and sample SD) and ordinal survey metrics (median, mode, Top-2-Box, and Bottom-2-Box).
Mean = Σ(i × c_i) / N; Sample SD = sqrt( Σ c_i(i − Mean)² / (N − 1) ); Net Agreement = Top-2-Box % − Bottom-2-Box %.
Each rating level (1 to 5) is also broken down by exact share of total responses N in the exported text report.
Review the input parameters, allowed value ranges, and worked reference cases for the Likert Scale Calculator below before running your calculation.
| Parameter / Scenario | Default / Sample Value | Rule or Allowed Range | Output / Usage Note |
|---|---|---|---|
| Input: 1 - Strongly Disagree count | 4 | Range: 0 to 10000000 | Required workspace parameter |
| Input: 2 - Disagree count | 9 | Range: 0 to 10000000 | Required workspace parameter |
| Input: 3 - Neutral / Neither count | 18 | Range: 0 to 10000000 | Required workspace parameter |
| Input: 4 - Agree count | 42 | Range: 0 to 10000000 | Required workspace parameter |
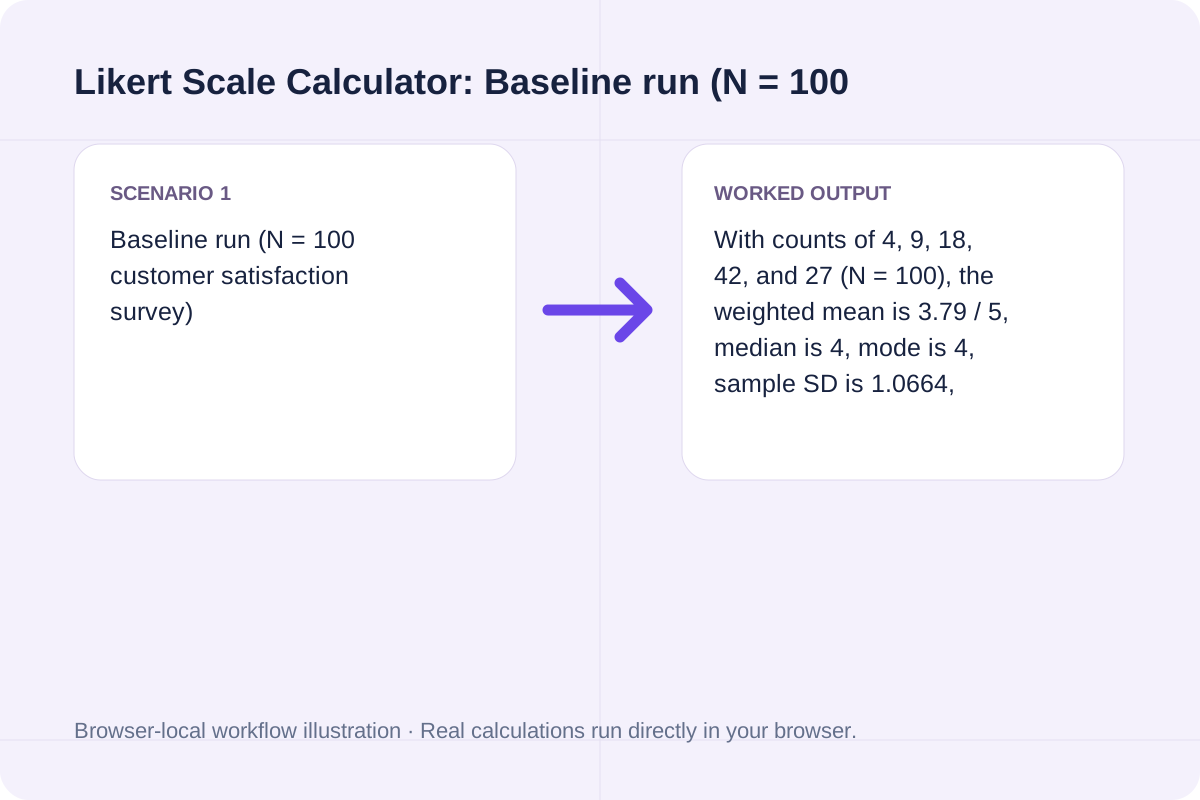
| Worked Case 1: Baseline run (N = 100 customer satisfaction survey) | Preloaded / test values | Weighted Mean = (1·c1 + 2·c2 + 3·c3 + 4·c4 + 5·c5) ÷ N; Sample SD = sqrt( Σ c_i·(i − Mean)² ÷ (N − 1) ); Top-2-Box % = (c4 + c5) ÷ N × 100 | With counts of 4, 9, 18, 42, and 27 (N = 100), the weighted mean is 3.79 / 5, median is 4, mode is 4, sample SD is 1.0664, Top-2-Box agreement is 69%, and Bottom-2-Box disagreement is 13% (Net Agreement +56%). |
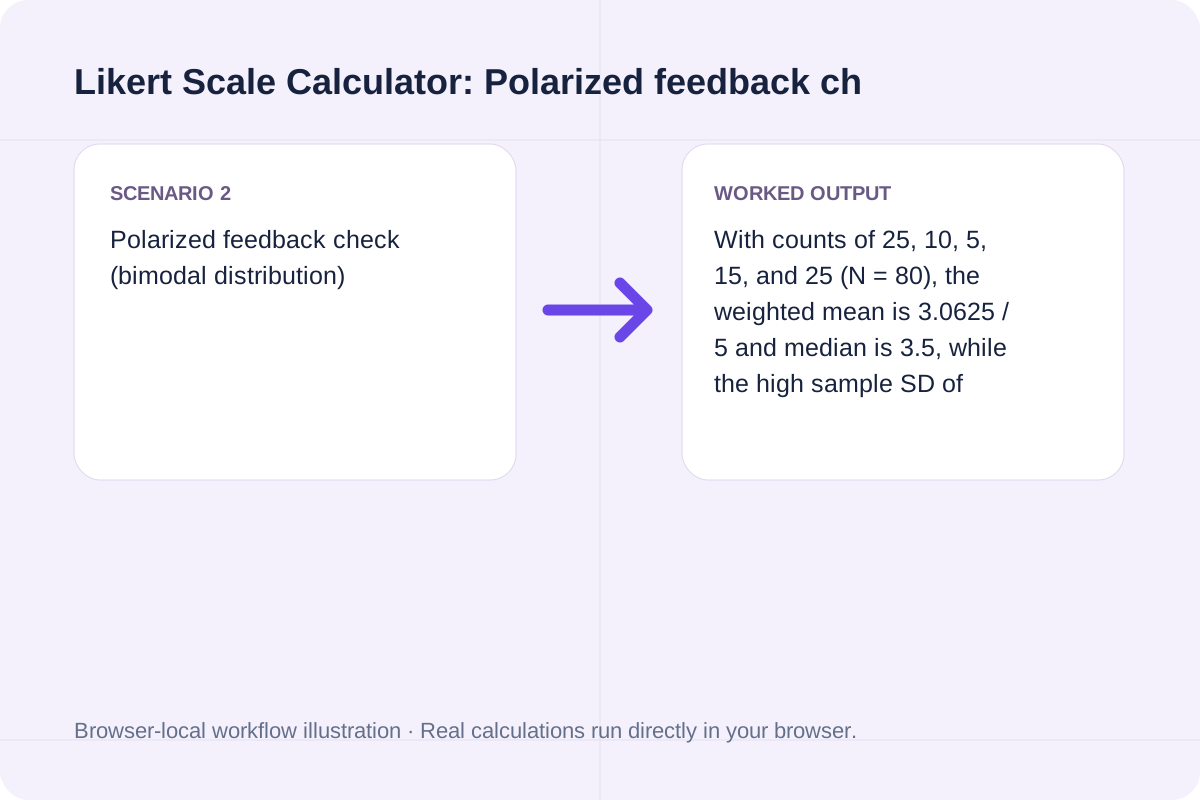
| Worked Case 2: Polarized feedback check (bimodal distribution) | Preloaded / test values | Weighted Mean = (1·c1 + 2·c2 + 3·c3 + 4·c4 + 5·c5) ÷ N; Sample SD = sqrt( Σ c_i·(i − Mean)² ÷ (N − 1) ); Top-2-Box % = (c4 + c5) ÷ N × 100 | With counts of 25, 10, 5, 15, and 25 (N = 80), the weighted mean is 3.0625 / 5 and median is 3.5, while the high sample SD of 1.6789 and 43.75% Bottom-2-Box rate reveal strong disagreement hidden by the middle average. |
Tally the response counts for a single survey question from your spreadsheet or form summary and enter the five integers.
Type the whole-number respondent counts for 1 (Strongly Disagree), 2 (Disagree), 3 (Neutral), 4 (Agree), and 5 (Strongly Agree).
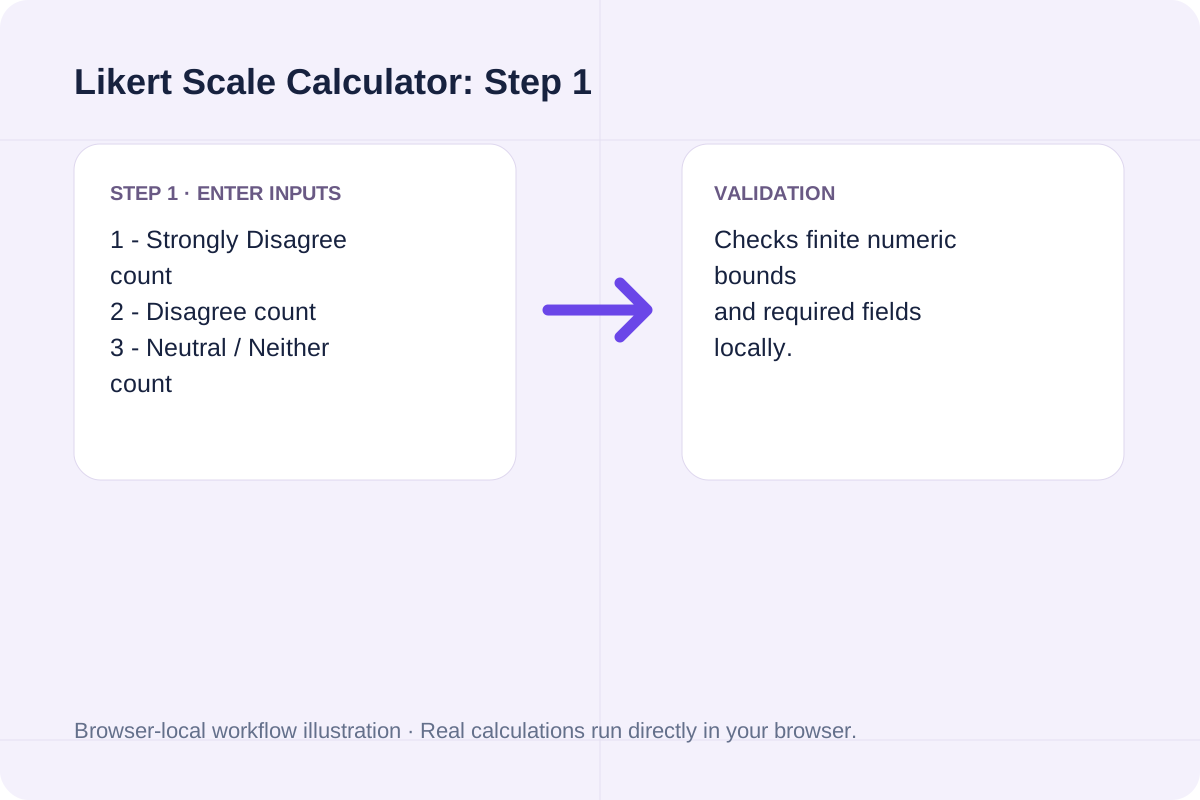
Confirm that all counts are non-negative integers and that at least one response is entered across the five options.
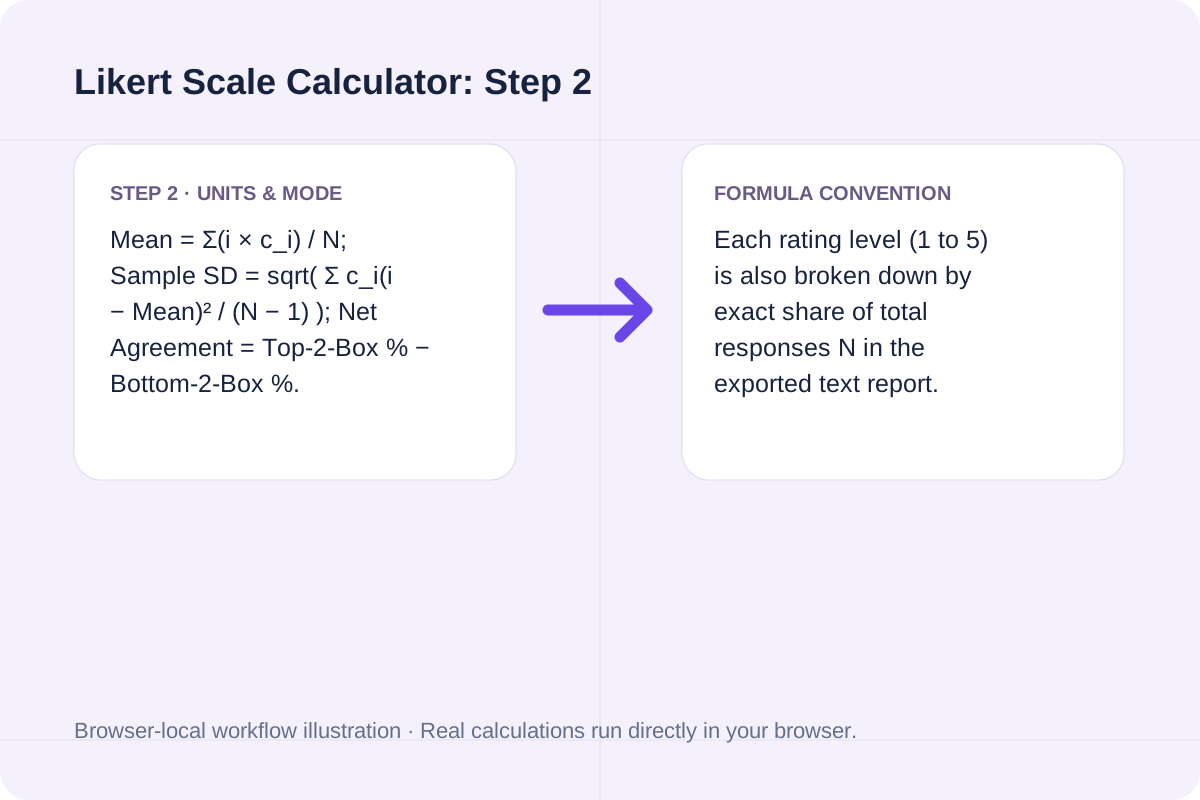
Click Calculate Likert stats to generate the mean, median, standard deviation, Top-2-Box share, and full frequency distribution.
Compare a positively skewed customer satisfaction item against a polarized employee feedback item.
With counts of 4, 9, 18, 42, and 27 (N = 100), the weighted mean is 3.79 / 5, median is 4, mode is 4, sample SD is 1.0664, Top-2-Box agreement is 69%, and Bottom-2-Box disagreement is 13% (Net Agreement +56%).
With counts of 25, 10, 5, 15, and 25 (N = 80), the weighted mean is 3.0625 / 5 and median is 3.5, while the high sample SD of 1.6789 and 43.75% Bottom-2-Box rate reveal strong disagreement hidden by the middle average.
If your questionnaire includes negatively phrased items, reverse-score their counts (swap 1 with 5, and 2 with 4) before comparing means across multiple questions.
Read the weighted mean alongside sample standard deviation and Top-2-Box agreement to avoid misreading polarized responses.
A weighted mean near 3.0 can represent either widespread neutrality (most respondents choosing 3) or sharp polarization (equal numbers choosing 1 and 5). Checking the sample standard deviation and the Top-2-Box versus Bottom-2-Box percentages immediately distinguishes consensus from division.
Verify scale polarity and missing-response handling before publishing survey tables.
This tool analyzes 5-point Likert items coded 1 through 5 and requires whole-number frequency counts. Exclude skipped or 'Not Applicable' responses from the five counts so they do not artificially pull the weighted mean toward 3.
Find a mean margin of error as critical value × population standard deviation / sqrt(n).
Open tool
Calculate standard deviation as a percentage of a positive mean.
Open tool
Find the minimum conjugate standard deviation allowed by the position-momentum uncertainty relation.
Open toolChoose another tool for your next calculation, conversion, or text task.

Convert linear charge density between listed units.
Open tool
Interpolate one y value between two known points.
Open tool
Find the average absolute deviation from the arithmetic mean.
Open tool
Find the median absolute deviation from the median.
Open toolAnswers about using Likert Scale Calculator and understanding its results.
Multiply each scale point (1 through 5) by its response count, sum those five products, and divide by the total number of responses N.
Top-2-Box combines the top two positive ratings (4 - Agree and 5 - Strongly Agree) as a percentage of total responses, while Bottom-2-Box combines the lowest two ratings (1 - Strongly Disagree and 2 - Disagree).
Because Likert items are ordinal, many researchers report both the median (along with Top-2-Box percentages) and the weighted mean with standard deviation so readers can see both central tendency and response dispersion.
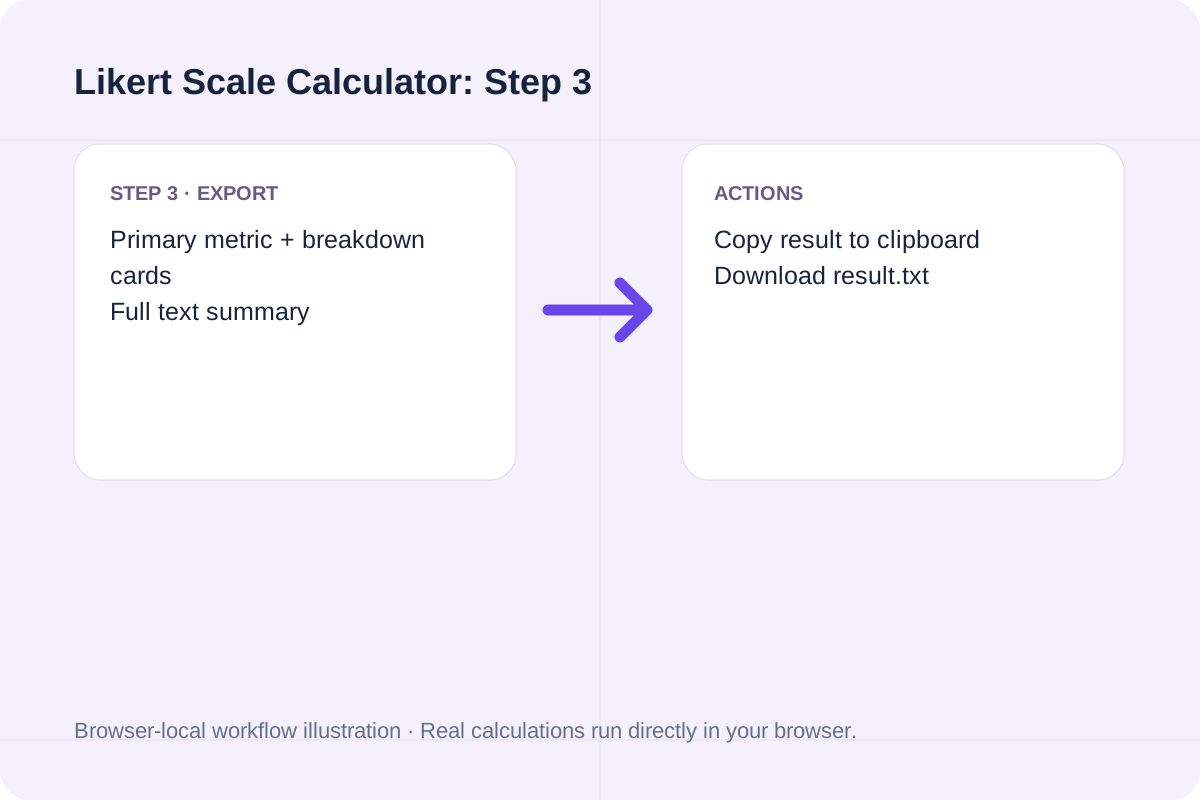
Yes. All calculations run locally in your browser. Use Copy result or Download result.txt to export the summary statistics and percentage distribution table.
Choose another tool for your next calculation, conversion, or text task.